Fig. 9
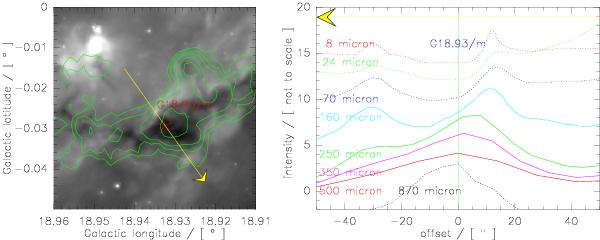
Profiles of mid-IR data along the cut indicated by the yellow arrow in the left panel. While the center of the cut in the right panel is G18.93/m, its upper end is chosen to be towards the potential ionizing sources. The different colored profiles in the right panel are of increasing wavelength, starting with 8 μm at the top going to 870 μm at the bottom. The intensities are not to scale, but adopted to fit in the panel. The green vertical line indicates the position of the ATLASGAL continuum peak, the yellow arrow corresponds in direction and length to the arrow in the left panel, in which the background image is a GLIMPSE 8 μm image with ATLASGAL contours (at 0.3 Jy, 0.4 Jy, 0.5 Jy, 0.7 Jy, 0.9 Jy, 1.3 Jy, 1.8 Jy, and 2.5 Jy) on top.
Current usage metrics show cumulative count of Article Views (full-text article views including HTML views, PDF and ePub downloads, according to the available data) and Abstracts Views on Vision4Press platform.
Data correspond to usage on the plateform after 2015. The current usage metrics is available 48-96 hours after online publication and is updated daily on week days.
Initial download of the metrics may take a while.