Fig. 8
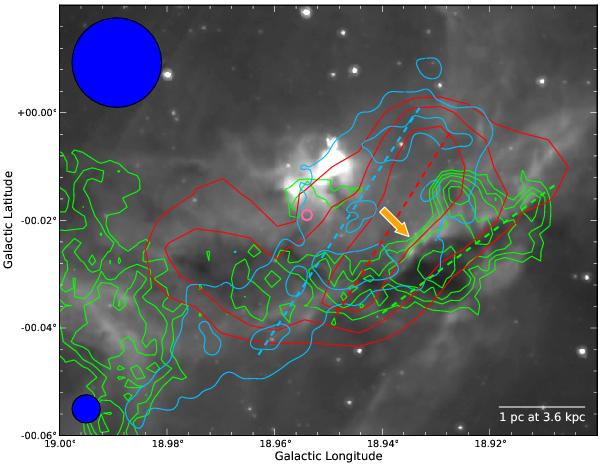
A layered structure of the hydrogen phase. On top of the 8 μm GLIMPSE image in gray, the blue contours represent the MAGPIS GPS 20 cm data, the red contours show a measure of the atomic hydrogen at velocities of G18.93 from the VGPS 21 cm line (for details see the text), and the green contours are the cold dust from the ATLASGAL survey, hence the molecular hydrogen. The dashed lines are to guide the eye and indicate the peak positions of the different data. The orange arrow points to 8 μm excess emission at the edge of the dense gas. The top left circle indicates the beam size of the VGPS data, while the bottom circle shows the beam of ATLASGAL. In this figure, MAGPIS is smoothed to the resolution of ATLASGAL. The contour levels for the GPS 20 cm data are 2 mJy/beam, 3 mJy/beam, 4 mJy/beam, and 5 mJy/beam, and for the ATLASGAL 870 μm emission 0.3 Jy, 0.4 Jy, 0.5 Jy, 0.7 Jy, 0.9 Jy, 1.3 Jy, 1.8 Jy, and 2.5 Jy.
Current usage metrics show cumulative count of Article Views (full-text article views including HTML views, PDF and ePub downloads, according to the available data) and Abstracts Views on Vision4Press platform.
Data correspond to usage on the plateform after 2015. The current usage metrics is available 48-96 hours after online publication and is updated daily on week days.
Initial download of the metrics may take a while.