Fig. 7
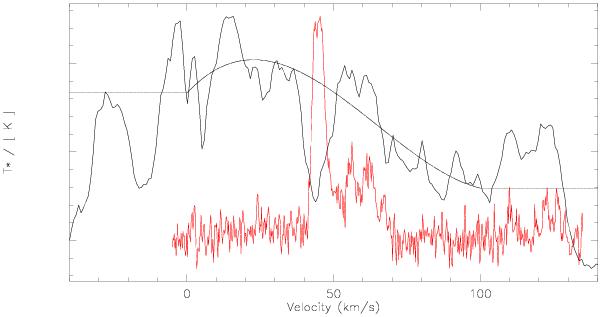
HI VGPS spectrum of G18.93/m in black with the GRS 13CO spectrum in red on top. The strong absorption feature of G18.93/m at ~45 km s-1 in the Hispectrum agrees very well with the 13CO signature. The smooth line indicates the 3rd order fit to the Hispectrum that has been used to subtract the “continuum”. (For details see text.)
Current usage metrics show cumulative count of Article Views (full-text article views including HTML views, PDF and ePub downloads, according to the available data) and Abstracts Views on Vision4Press platform.
Data correspond to usage on the plateform after 2015. The current usage metrics is available 48-96 hours after online publication and is updated daily on week days.
Initial download of the metrics may take a while.