Fig. 6
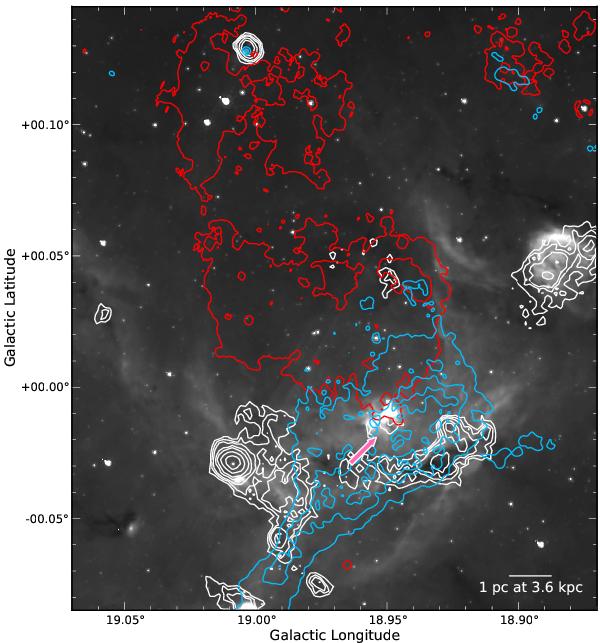
The ionized gas within and around the bubble. On top of the GLIMPSE 8 μm image, the red contours show the Hα emission from the SuperCOSMOS survey, the blue contours represent the MAGPIS 20 cm emission, and white contours show the ATLASGAL emission (at 0.3 Jy, 0.4 Jy, 0.5 Jy, 0.7 Jy, 0.9 Jy, 1.3 Jy, 1.8 Jy, and 2.5 Jy). The contour levels for the MAGPIS data are 0.002 Jy/beam, 0.003 Jy/beam, 0.004 Jy/beam, and 0.005 Jy/beam. The arrow indicates the peak position of the Hii region identified by Lockman (1989).
Current usage metrics show cumulative count of Article Views (full-text article views including HTML views, PDF and ePub downloads, according to the available data) and Abstracts Views on Vision4Press platform.
Data correspond to usage on the plateform after 2015. The current usage metrics is available 48-96 hours after online publication and is updated daily on week days.
Initial download of the metrics may take a while.