Free Access
Fig. 5
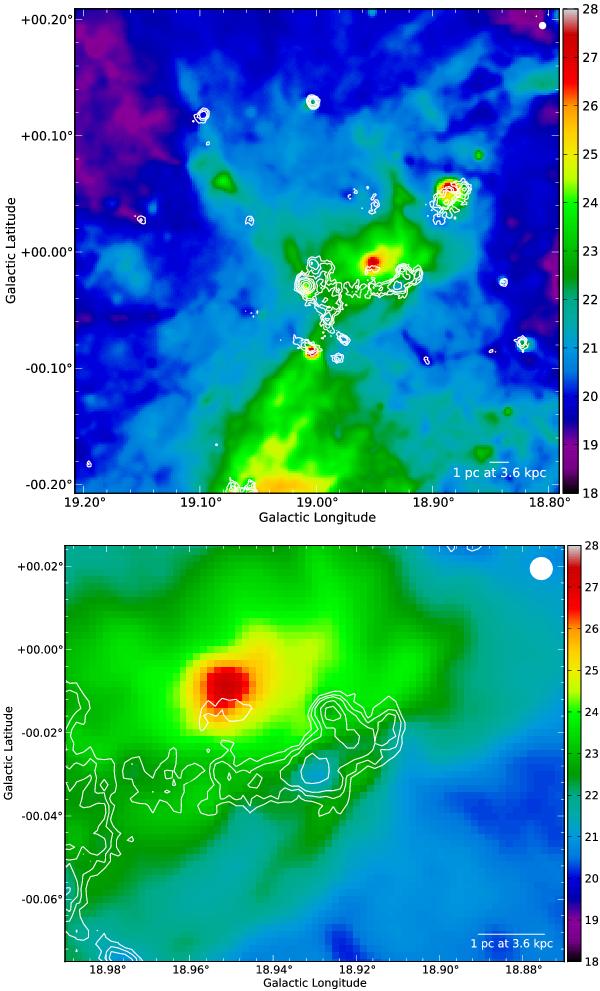
Color coded temperature maps in [K] of G18.93, shown by the white contours from ATLASGAL (at 0.3 Jy, 0.4 Jy, 0.5 Jy, 0.7 Jy, 0.9 Jy, 1.3 Jy, 1.8 Jy, and 2.5 Jy). The beam size is indicated in the top right corner. While the top panel presents the large-scale environment, the bottom panel zooms into our central IRDC region.
Current usage metrics show cumulative count of Article Views (full-text article views including HTML views, PDF and ePub downloads, according to the available data) and Abstracts Views on Vision4Press platform.
Data correspond to usage on the plateform after 2015. The current usage metrics is available 48-96 hours after online publication and is updated daily on week days.
Initial download of the metrics may take a while.