Free Access
Fig. 4
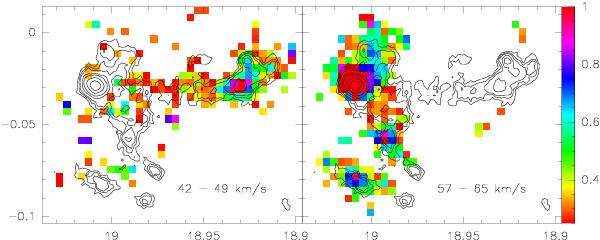
Color coded map of the H13CO+ emission in [K km s-1] for the velocity regime 42 km s-1 to 49 km s-1 on the left, and 56 km s-1 to 65 km s-1 on the right. The black contours are from ATLASGAL with levels at 0.3 Jy, 0.4 Jy, 0.5 Jy, 0.7 Jy, 0.9 Jy, 1.3 Jy, 1.8 Jy, and 2.5 Jy.
Current usage metrics show cumulative count of Article Views (full-text article views including HTML views, PDF and ePub downloads, according to the available data) and Abstracts Views on Vision4Press platform.
Data correspond to usage on the plateform after 2015. The current usage metrics is available 48-96 hours after online publication and is updated daily on week days.
Initial download of the metrics may take a while.