Fig. 11
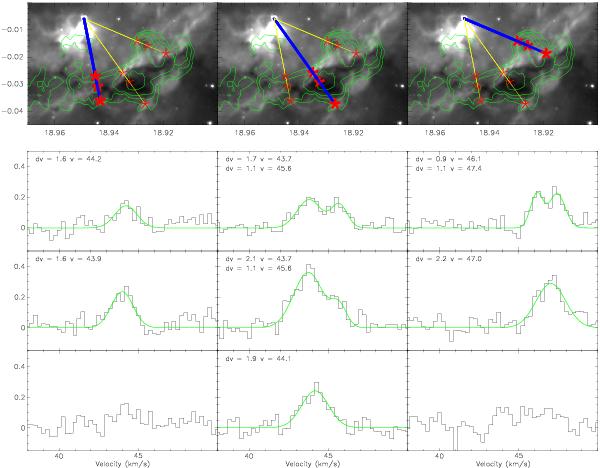
H13CO+ spectra at positions indicated by bold asterisks in the top panel. The positions are chosen to lie along the connection between the UKIDSS near-IR source and the ATLASGAL peak position, with the first spectra at the peak of the GLIMPSE 8 μm emission. From left to right the clumps are G18.93/1, G18.93/m, and G18.93/4. The upper spectra are at positions closer to the ionizing source. Where possible we fitted one, two, or three gaussian components to the spectra. The fitted line widths and peak positions are given in the spectra.
Current usage metrics show cumulative count of Article Views (full-text article views including HTML views, PDF and ePub downloads, according to the available data) and Abstracts Views on Vision4Press platform.
Data correspond to usage on the plateform after 2015. The current usage metrics is available 48-96 hours after online publication and is updated daily on week days.
Initial download of the metrics may take a while.