Fig. 10
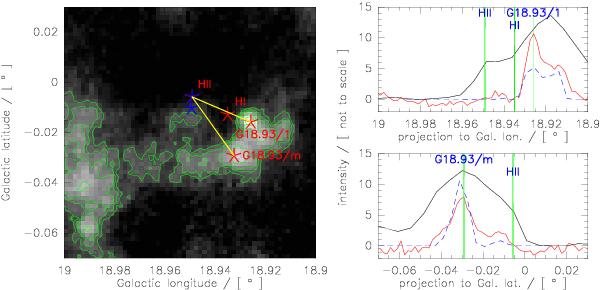
Profile of 13CO (black), ATLASGAL (red), and H13CO+ (dashed blue) along the two yellow lines shown on top of the 870 μm map in the left plot. The position of the peak of Hii emission is indicated within both profiles (right) and the map (left). The left panel also gives the two main IRDC peaks. The blue asterisks indicate the position of the IRAS source (lower position) and UKIDSS source (higher position). The green contours from ATLASGAL are at 0.3 Jy, 0.4 Jy, 0.5 Jy, 0.7 Jy, 0.9 Jy, 1.3 Jy, 1.8 Jy, and 2.5 Jy.
Current usage metrics show cumulative count of Article Views (full-text article views including HTML views, PDF and ePub downloads, according to the available data) and Abstracts Views on Vision4Press platform.
Data correspond to usage on the plateform after 2015. The current usage metrics is available 48-96 hours after online publication and is updated daily on week days.
Initial download of the metrics may take a while.