Fig. 1
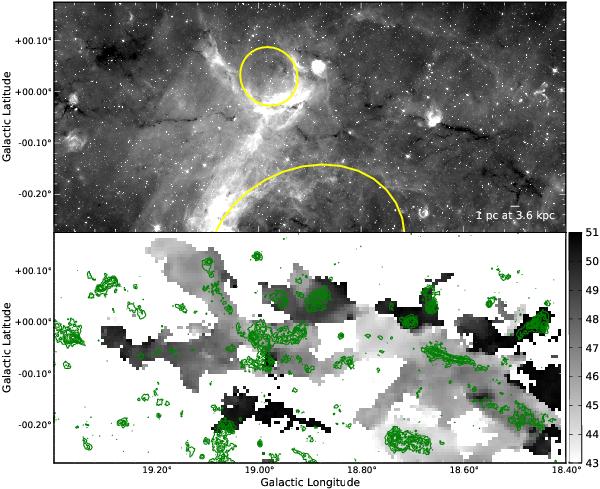
An IRDC filament along the Galactic plane, spanning across from the lower right (18.45°, –0.20°) to the upper left (19.30°, –0.02°). The top panel shows a 8 μm Spitzer image and the color stretch is chosen to bring the IRDC to prominence. The lower panel presents the intensity weighted peak velocity (moment 1) map of the GRS 13CO data. Regions with velocities outside the 43 km s-1 to 51 km s-1 are clipped. The green contours are from ATLASGAL with contour levels at 0.15 Jy or 3σ, 0.3 Jy, 0.4 Jy, 0.5 Jy, 0.7 Jy, 0.9 Jy, 1.3 Jy, 1.8 Jy, and 2.5 Jy. The yellow ellipses indicate the bubbles as given in Simpson et al. (2012).
Current usage metrics show cumulative count of Article Views (full-text article views including HTML views, PDF and ePub downloads, according to the available data) and Abstracts Views on Vision4Press platform.
Data correspond to usage on the plateform after 2015. The current usage metrics is available 48-96 hours after online publication and is updated daily on week days.
Initial download of the metrics may take a while.