Fig. 5
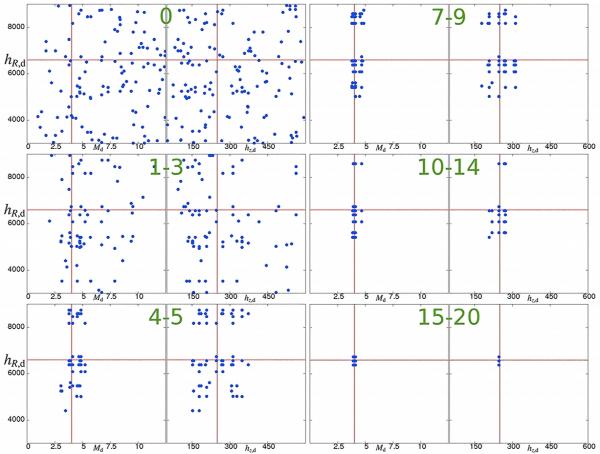
Evolution of the dust parameters for a population of 100 individuals for the test model with three free parameters. The different panels show the position of each individual in the hR,d versus hz,d and the hR,d versus Md projections of the 3D parameter space, for different generations (indicated by the green numbers on the top of each panel). The input values of the parameters are indicated by red lines.
Current usage metrics show cumulative count of Article Views (full-text article views including HTML views, PDF and ePub downloads, according to the available data) and Abstracts Views on Vision4Press platform.
Data correspond to usage on the plateform after 2015. The current usage metrics is available 48-96 hours after online publication and is updated daily on week days.
Initial download of the metrics may take a while.