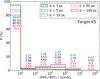
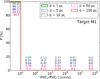
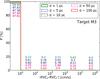
Fig. 9
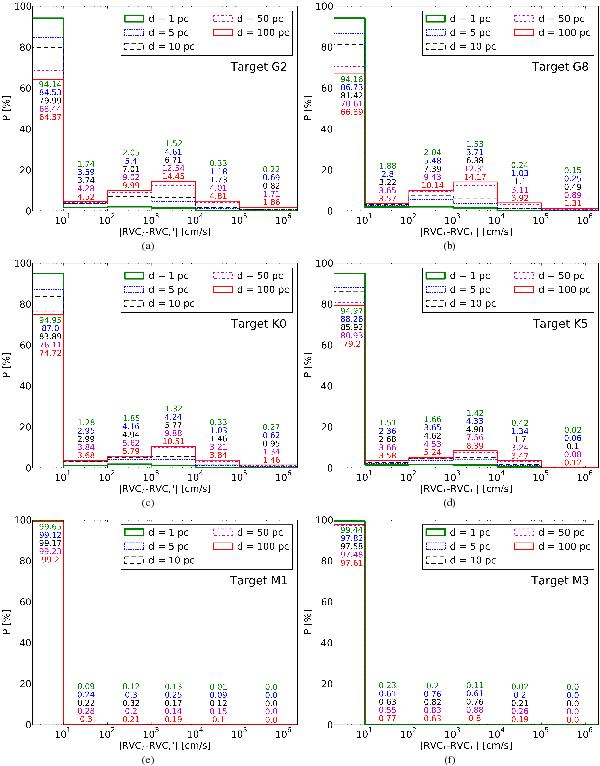
Close-up of the distribution of the expected contamination,  , on the radial velocity, |RVCt|, of a target star of spectral type a) G2, b) G8, c) K0, d) K5, e) M1, and f) M3, and at distance d, caused by a background or a companion star. The green thick solid line shows the distribution if the target star stands at a distance of d = 1 pc, the blue dotted line for d = 5 pc, black dashed line for d = 10 pc, magenta dash-dotted line for d = 50 pc, and red solid line for 100 pc. Numbers in each bin correspond to the impact probability for each target distance: the number in the top corresponds to 1 pc and the number in the bottom to 100 pc.
Current usage metrics show cumulative count of Article Views (full-text article views including HTML views, PDF and ePub downloads, according to the available data) and Abstracts Views on Vision4Press platform.
Data correspond to usage on the plateform after 2015. The current usage metrics is available 48-96 hours after online publication and is updated daily on week days.
Initial download of the metrics may take a while.