Fig.13
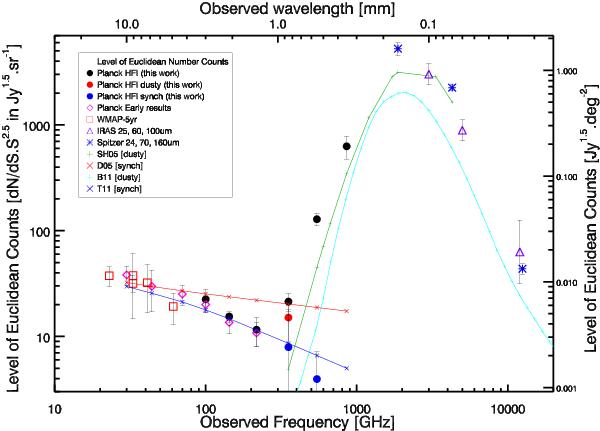
Euclidean level p (plateau in S2.5dN/dS, see Eq. (1)) for bright sources, expressed in number of galaxies times Jy1.5 sr-1 (or Jy1.5 deg-2 on the right axis) averaged between approximately 1 and 3 Jy at microwave to mid-IR frequencies. We specifically show: our Planck HFI results (black circles), and separately dusty sources (red circles) and synchrotron sources (blue circles). The dusty 545 GHz point is almost on top of the total Planck point. Also shown are: Planck Early results (purple diamonds) from (Planck Collaboration 2011d); WMAP-5year (red squares) from Wright et al. (2009); Massardi et al. (2009); de Zotti et al. (2010); IRAS 25, 60 and 100 μm results (purple triangles) from Hacking & Soifer (1991), Lonsdale & Hacking (1989), and Bertin & Dennefeld (1997); and Spitzer 24, 70 and 160 μm (blue stars) from Bethermin et al. (2010a). We also plot the models (solid lines): Serjeant & Harrison (2005), based on IRAS and SCUBA data and dealing with dusty galaxies (SH05 green plus signs); Bethermin et al. (2011) (B11 light blue plus signs) dealing with dusty galaxies; de Zotti et al. (2005) (D05 red crosses) dealing with synchrotron sources; Tucci et al. (2011) (T11 blue crosses) for synchrotron sources. Values are given in Table 8.
Current usage metrics show cumulative count of Article Views (full-text article views including HTML views, PDF and ePub downloads, according to the available data) and Abstracts Views on Vision4Press platform.
Data correspond to usage on the plateform after 2015. The current usage metrics is available 48-96 hours after online publication and is updated daily on week days.
Initial download of the metrics may take a while.