Fig. 7
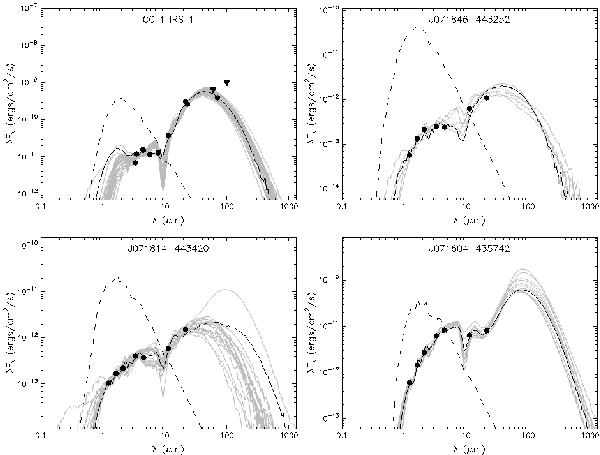
SED fits for our NIR excess sources. NX Pup is omitted as it has been previously modelled (see text). The filled circles are the observed fluxes and the triangles mark the fluxes where there is only an upper limit. The solid line marks the best fit, and the grey lines shows fits with  per each data point. The dashed line indicates the unreddened SED of the stellar photosphere of central source in the best fitting model.
Current usage metrics show cumulative count of Article Views (full-text article views including HTML views, PDF and ePub downloads, according to the available data) and Abstracts Views on Vision4Press platform.
Data correspond to usage on the plateform after 2015. The current usage metrics is available 48-96 hours after online publication and is updated daily on week days.
Initial download of the metrics may take a while.