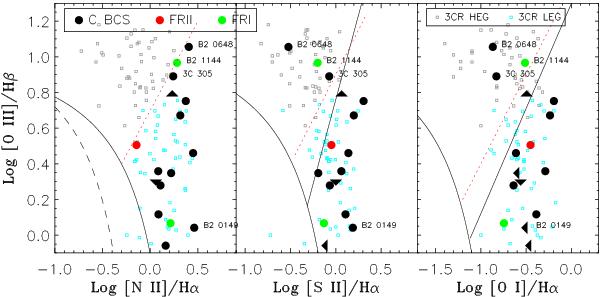
Fig. 3

Diagnostic diagrams: the curves are taken from Kewley et al. (2006) and divide galaxies into star-forming, HEG and LEG AGNs. The region between the dashed line and the solid line in the first diagram indicates the position of composite galaxies. The dotted lines mark the empirical boundaries between HEG (gray squares) and LEG (cyan squares) in each diagram as derived for the 3CR sample (Buttiglione et al. 2010). The C BCS are indicated with black circles, FR II E BCS with red circles and FR I E BCS with green circles (see Table 5). Upper limits (UL) on the emission line measurements are indicated by triangles pointing toward them (i.e. an UL in Hβ is indicated with a triangle pointing up).
Current usage metrics show cumulative count of Article Views (full-text article views including HTML views, PDF and ePub downloads, according to the available data) and Abstracts Views on Vision4Press platform.
Data correspond to usage on the plateform after 2015. The current usage metrics is available 48-96 hours after online publication and is updated daily on week days.
Initial download of the metrics may take a while.


