Free Access
Fig. 1
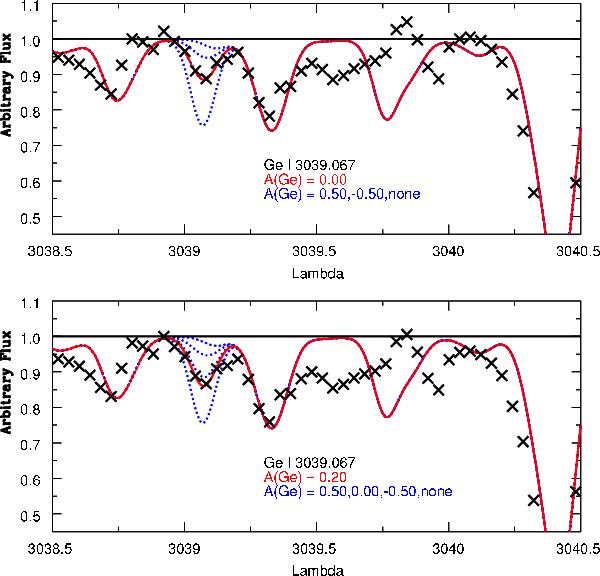
Fits of the Ge I 3039.067 Å line in CS 31082-001 for two different placements of the continuum. Crosses: observations. Dotted lines: synthetic spectra computed for the abundances indicated in the figure. Solid line: synthetic spectrum computed with the best abundance, also indicated in the figure.
Current usage metrics show cumulative count of Article Views (full-text article views including HTML views, PDF and ePub downloads, according to the available data) and Abstracts Views on Vision4Press platform.
Data correspond to usage on the plateform after 2015. The current usage metrics is available 48-96 hours after online publication and is updated daily on week days.
Initial download of the metrics may take a while.