Fig. 9
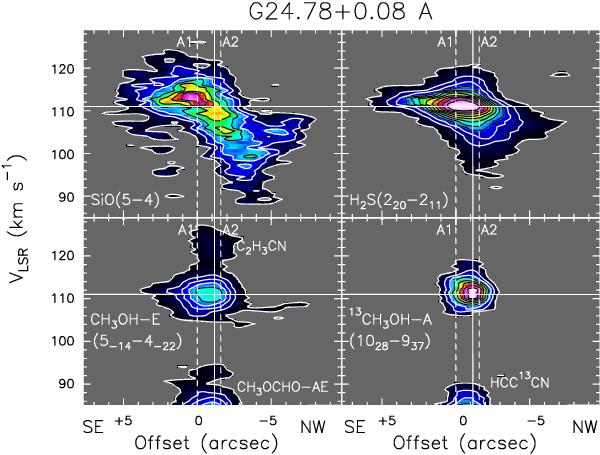
Position-velocity cut of SiO(5–4), H2S(22,0–21,1), CH3OH-E(5−1,4–4-22), and 13CH3OH–A(102,8–93,7) along the outflow A (PA = –40°). The position offsets are measured from the A1 position, positive towards northwest. The rms 1σ is 20 mJy beam-1. Contour levels range from 3σ by steps of 3σ for SiO and 13CH3OH–A, and from 3σ by steps of 10σ for H2S and CH3OH-E. Dashed vertical lines mark the position of the A1 and A2 YSOs, while the solid vertical line is for the average peak position of the typical hot-core tracers (see text). Solid horizontal line shows the systemic velocity (+111.0 km s-1).
Current usage metrics show cumulative count of Article Views (full-text article views including HTML views, PDF and ePub downloads, according to the available data) and Abstracts Views on Vision4Press platform.
Data correspond to usage on the plateform after 2015. The current usage metrics is available 48-96 hours after online publication and is updated daily on week days.
Initial download of the metrics may take a while.