Fig. 8
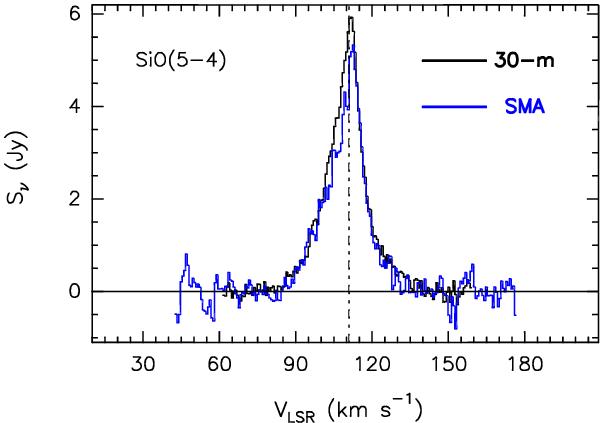
Comparison between the SiO(5–4) line profile (in flux density, Sν, scale) observed with the IRAM 30-m antenna (black) and the spectrum obtained from the SMA data (blue) by integrating over a region equal to the IRAM 30-m beam (11″). For this comparison the IRAM 30-m spectrum has been resampled to the spectral resolution of the SMA data (0.67 km s-1). The dashed lines stand for the systemic velocity (+111.0 km s-1).
Current usage metrics show cumulative count of Article Views (full-text article views including HTML views, PDF and ePub downloads, according to the available data) and Abstracts Views on Vision4Press platform.
Data correspond to usage on the plateform after 2015. The current usage metrics is available 48-96 hours after online publication and is updated daily on week days.
Initial download of the metrics may take a while.