Fig. 5
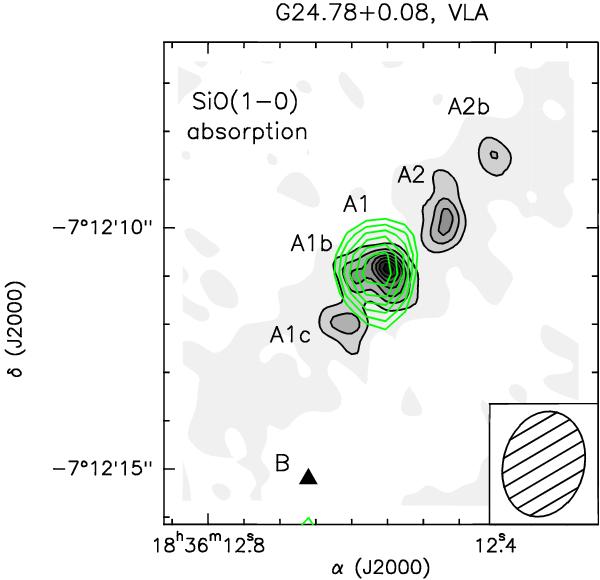
Zoom-in of the central region of G24.78+0.08, where the cluster of A1−A2
continuum sources (grey scale) has been mapped at high angular resolution by Beltrán
et al. (2011) using a very extended SMA
configuration ( ). The spatial
distribution of the blue-shifted (from +106 to +110 km s-1) absorption
(see Fig. 4) observed towards A1 is reported by the
green contours. Contour levels range from –10σ to
–3σ by steps of 1σ (0.3 mJy
beam-1 km s-1). The filled ellipse in the bottom-right
corner shows the synthesised beam (HPBW):
). The spatial
distribution of the blue-shifted (from +106 to +110 km s-1) absorption
(see Fig. 4) observed towards A1 is reported by the
green contours. Contour levels range from –10σ to
–3σ by steps of 1σ (0.3 mJy
beam-1 km s-1). The filled ellipse in the bottom-right
corner shows the synthesised beam (HPBW):  (PA = –15°).
Current usage metrics show cumulative count of Article Views (full-text article views including HTML views, PDF and ePub downloads, according to the available data) and Abstracts Views on Vision4Press platform.
Data correspond to usage on the plateform after 2015. The current usage metrics is available 48-96 hours after online publication and is updated daily on week days.
Initial download of the metrics may take a while.