Fig. 4
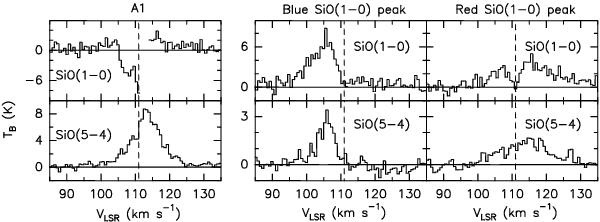
Examples of SiO(1–0) and (5–4) line profiles (in brightness temperature TB, scale) observed towards A1 (left panel) and the peak positions of the blue- and red-shifted (middle and right panel) SiO(1–0) line emission. Dashed lines mark the systemic velocity (+111 km s-1).
Current usage metrics show cumulative count of Article Views (full-text article views including HTML views, PDF and ePub downloads, according to the available data) and Abstracts Views on Vision4Press platform.
Data correspond to usage on the plateform after 2015. The current usage metrics is available 48-96 hours after online publication and is updated daily on week days.
Initial download of the metrics may take a while.