Fig. 13
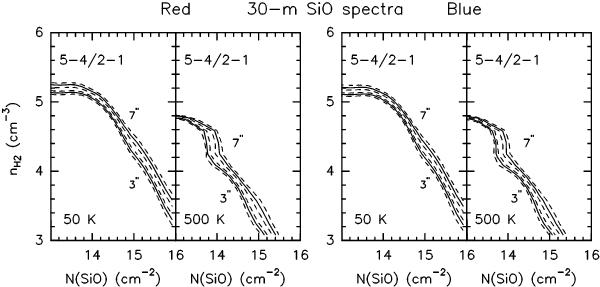
Analysis of the SiO red-shifted line emission in the G24.78+0.08 outflow A observed with the IRAM 30-m antenna. The solutions for the observed SiO(5–4)/SiO(2–1) intensity ratio are shown in the nH2–N(SiO) plot for non-LTE (RADEX) plane-parallel models at the labeled kinetic temperatures. Solid contours are for the measured ratios at the typical red- (+116 km s-1) and blue-shifted (+106 km s-1) velocities, after correction for a beam dilution derived assuming a source size of 3″ and 7″ (see text). The SiO(5–4)/SiO(2–1) ratios are 0.21 (3″; +116 km s-1), 0.19 (3″; +106 km s-1), 0.27 (7″; +116 km s-1), and 0.30 (7″; +106 km s-1). Dashed contours take into account the uncertainties.
Current usage metrics show cumulative count of Article Views (full-text article views including HTML views, PDF and ePub downloads, according to the available data) and Abstracts Views on Vision4Press platform.
Data correspond to usage on the plateform after 2015. The current usage metrics is available 48-96 hours after online publication and is updated daily on week days.
Initial download of the metrics may take a while.