Fig. 12
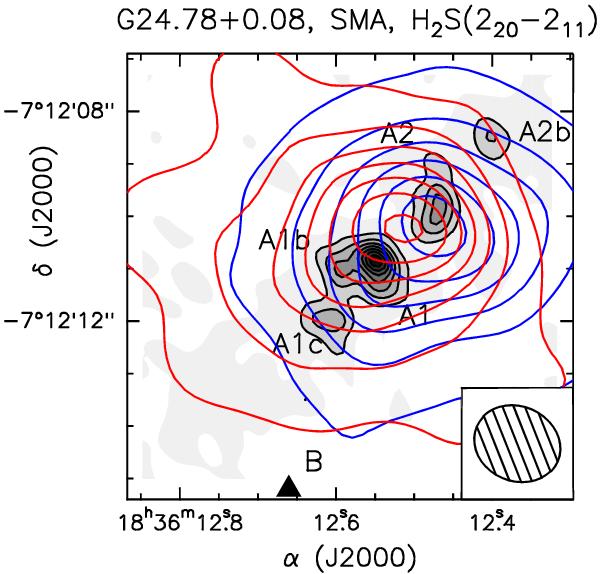
Contour map of blue- and red-shifted
H2S(22,0–21,1)
SMA emission superimposed on the 1.3 mm continuum emission as observed at high
angular resolution by Beltrán et al. (2011)
using a very extended SMA configuration ( ). The sources of the
G24.78+0.08 cluster are labelled following Furuya et al. (2002) and Beltrán et al. (2004, 2011). The H2S
emission was averaged over the velocity intervals (+94,+111) km s-1 and
(+111,+124) km s-1 for the blue- and red-shifted emission,
respectively. The rms 1σ is 18 mJy
beam-1 km s-1. Contour levels range from 5σ
by steps of 10σ. The filled ellipse in the bottom-right corner
shows the synthesised beam (HPBW):
). The sources of the
G24.78+0.08 cluster are labelled following Furuya et al. (2002) and Beltrán et al. (2004, 2011). The H2S
emission was averaged over the velocity intervals (+94,+111) km s-1 and
(+111,+124) km s-1 for the blue- and red-shifted emission,
respectively. The rms 1σ is 18 mJy
beam-1 km s-1. Contour levels range from 5σ
by steps of 10σ. The filled ellipse in the bottom-right corner
shows the synthesised beam (HPBW):  (PA = 67°).
Current usage metrics show cumulative count of Article Views (full-text article views including HTML views, PDF and ePub downloads, according to the available data) and Abstracts Views on Vision4Press platform.
Data correspond to usage on the plateform after 2015. The current usage metrics is available 48-96 hours after online publication and is updated daily on week days.
Initial download of the metrics may take a while.