Fig. 1
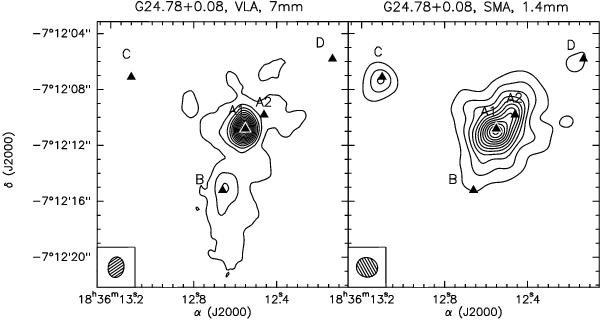
Contour plots of the continuum emission at 7 (left panel) and
1.4 mm (right panel) imaged with the VLA and SMA interferometers,
respectively. The black triangles mark the positions of the sources identified by
Furuya et al. (2002) and Beltrán et al.
(2004). The 1σ rms of the
maps is 6.0 (at 1.4 mm) and 0.8 mJy beam-1 (at 7 mm), while first
contours and steps correspond to 3σ and 6σ. The
ellipses in the bottom-left corners show the HPBW:
 (PA = 74°; SMA) and
 (PA = −11°; VLA).
Current usage metrics show cumulative count of Article Views (full-text article views including HTML views, PDF and ePub downloads, according to the available data) and Abstracts Views on Vision4Press platform.
Data correspond to usage on the plateform after 2015. The current usage metrics is available 48-96 hours after online publication and is updated daily on week days.
Initial download of the metrics may take a while.