Fig. 8
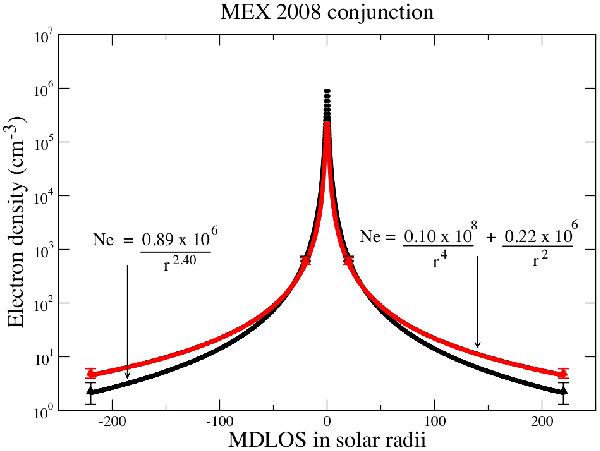
Example of the comparison between electron density models given in Eqs. (3) and (4). The electron density profiles are plotted from 1 R⊙ to 215 R⊙ (1 AU) for the MEX 2008 conjunction using the model parameters given in Table 2. The error bars plotted in the figure correspond to the electron density obtained at 20 R⊙ and 215 R⊙ (see Table 2).
Current usage metrics show cumulative count of Article Views (full-text article views including HTML views, PDF and ePub downloads, according to the available data) and Abstracts Views on Vision4Press platform.
Data correspond to usage on the plateform after 2015. The current usage metrics is available 48-96 hours after online publication and is updated daily on week days.
Initial download of the metrics may take a while.