Fig. 6
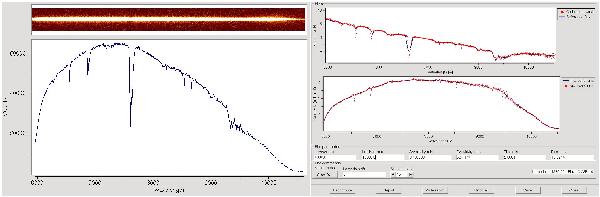
Example of the spectrophotometric calibration for a FORS2 observation with grism 300I and sorting filter OG590. Left panel: extracted 1D spectrum of the standard star, not yet corrected for the CCD response function. Right panel, top: the expected spectrum of the standard star provided by the SPHOT table (continuous line) and the fitted one (red points) according to the spectral resolution of the observation. The sensitivity function (bottom panel) is then computed as the ratio between the extracted 1D spectrum and the fitted standard star spectrum converted into erg cm-2 s-1 Å-1. The user can edit the originally computed sensitivity function (red points) and choose the final one (continuous line) to apply to the single spectra for calibrating them into flux.
Current usage metrics show cumulative count of Article Views (full-text article views including HTML views, PDF and ePub downloads, according to the available data) and Abstracts Views on Vision4Press platform.
Data correspond to usage on the plateform after 2015. The current usage metrics is available 48-96 hours after online publication and is updated daily on week days.
Initial download of the metrics may take a while.