Fig. 4
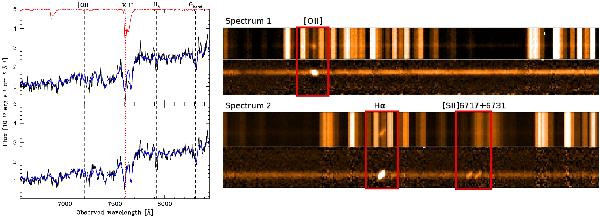
Example of the good quality achievable through the removal of absorption (left) and emission (right) sky features with F-VIPGI. Left panel: atmospheric correction for a spectrum of a passive galaxy at z ~ 0.9 observed with grism 300I. Top: flux-calibrated spectrum (in black) without the atmospheric correction applied. It is evident that the telluric lines at λ ~ 7600 Å strongly affect the S/N of the 4000-Å break and the CaII (H, K) lines. Bottom: the same spectrum after applying the atmospheric absorption correction. Now the CaII lines are completely recovered. In red (solid and dotted curves) the positions of the most prominent telluric lines are shown. The black dashed lines mark the position of the most important spectral features in the displayed wavelength range. The best-fitting template of both spectra (an LRG one at z = 0.930) is overlaid in blue in both panels for reference. Right panel: subtraction of the emission sky lines from two spectra with different redshift (spectrum1 at z = 1.086, spectrum2 at z = 0.282). For each object the same part of the spectrum before and after the sky subtraction is shown at the top and bottom, respectively. In addition, the strongest spectroscopic features of each object are marked by the red boxes and are labeled on the top side. Although some residuals of the sky removal are visible in the bottom panels, the pipeline efficiently subtracts the undesired sky features and recovers the science features, which are sometimes completely outshone by the atmospheric emission.
Current usage metrics show cumulative count of Article Views (full-text article views including HTML views, PDF and ePub downloads, according to the available data) and Abstracts Views on Vision4Press platform.
Data correspond to usage on the plateform after 2015. The current usage metrics is available 48-96 hours after online publication and is updated daily on week days.
Initial download of the metrics may take a while.