Fig. 3
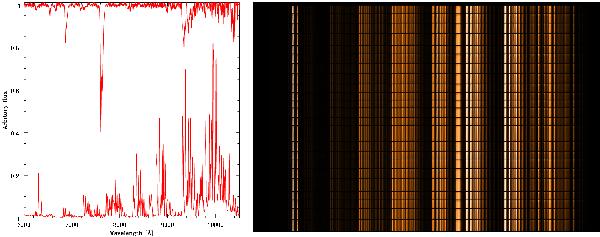
Left: spectral absorption (top side) and emission (bottom side) features introduced by the night sky in the λ > 6000 Å spectral region. Right: 2D emission spectra of the sky extracted for all slits of a FORS2 mask. The vertical alignment of the sky lines is indicative of a very good wavelength calibration over the entire mask.
Current usage metrics show cumulative count of Article Views (full-text article views including HTML views, PDF and ePub downloads, according to the available data) and Abstracts Views on Vision4Press platform.
Data correspond to usage on the plateform after 2015. The current usage metrics is available 48-96 hours after online publication and is updated daily on week days.
Initial download of the metrics may take a while.