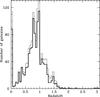
Fig. 2
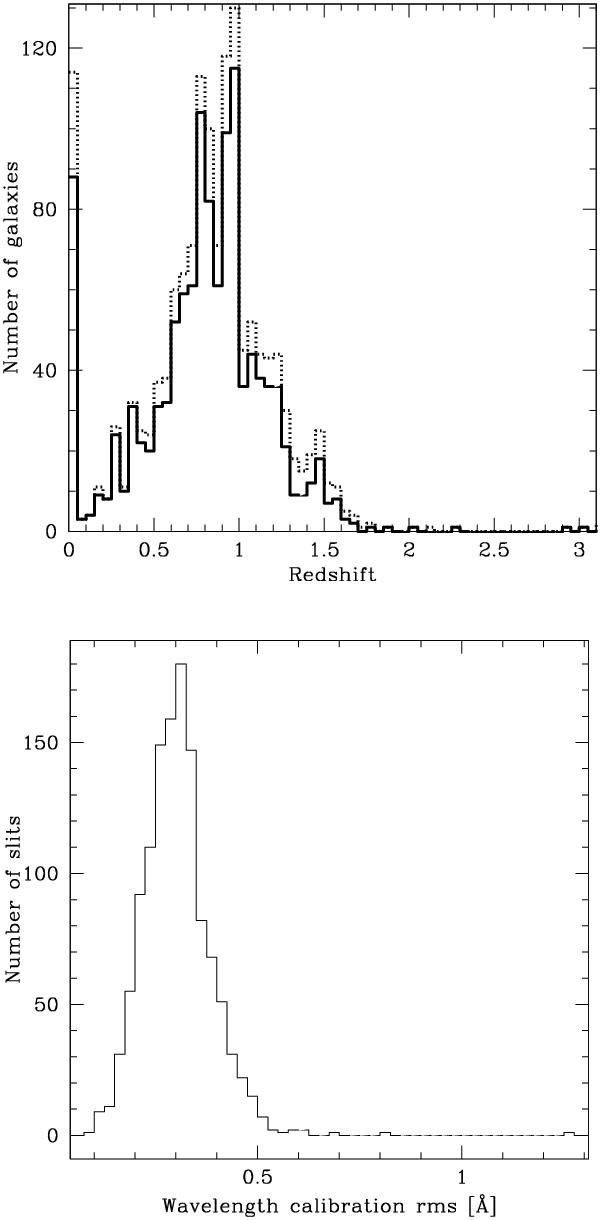
Top: redshift distribution of 1543 FORS2 spectra produced by XDCP and extracted with F-VIPGI. The solid line marks the secure assigned redshifts ( ≥ 75% confidence on the assigned value) while the dotted line refers to unsafe ones (confidence ≤ 50%). The secure assessments represent ~72% of the entire sample at 0 < z ≤ 3 and increases to ~78% including also stars. Bottom: distribution of rms wavelength calibrations computed for the corresponding 1230 reduced slits observed with the grism 300I+11. The median value is ⟨ rms ⟩ λ = (0.30 ± 0.05) Å.
Current usage metrics show cumulative count of Article Views (full-text article views including HTML views, PDF and ePub downloads, according to the available data) and Abstracts Views on Vision4Press platform.
Data correspond to usage on the plateform after 2015. The current usage metrics is available 48-96 hours after online publication and is updated daily on week days.
Initial download of the metrics may take a while.