Fig. 15
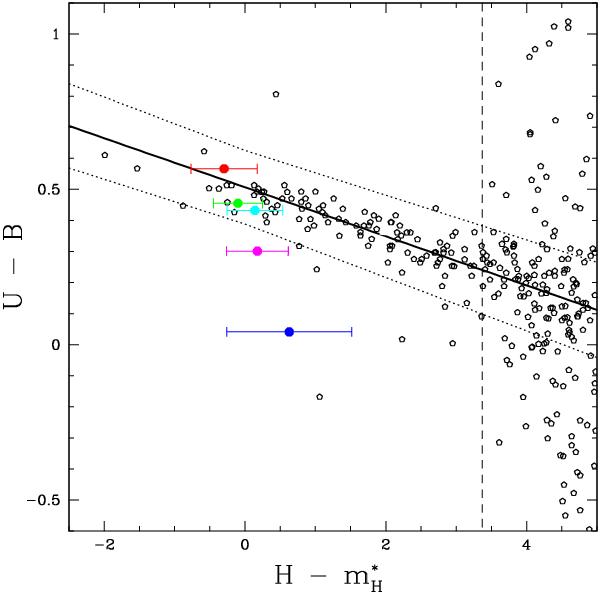
CMR of Coma Cluster galaxies (black pentagons) and the red sequence best fit, computed only for the early-type galaxies defined as brighter than H = 14.5 (at the left of the dashed vertical line), with relative scatter (black dotted lines) as provided by Eisenhardt et al. (2007). The overplotted colored points mark the values obtained for the average spectra representative of the high-z cluster members, with the same color code as defined in Fig. 9. Note that for a consistent comparison all the observed H-band magnitudes were rescaled to the corresponding  values, as explained in the text. For Coma galaxies a value of
  = 11.13 was used.
Current usage metrics show cumulative count of Article Views (full-text article views including HTML views, PDF and ePub downloads, according to the available data) and Abstracts Views on Vision4Press platform.
Data correspond to usage on the plateform after 2015. The current usage metrics is available 48-96 hours after online publication and is updated daily on week days.
Initial download of the metrics may take a while.