Fig. 1
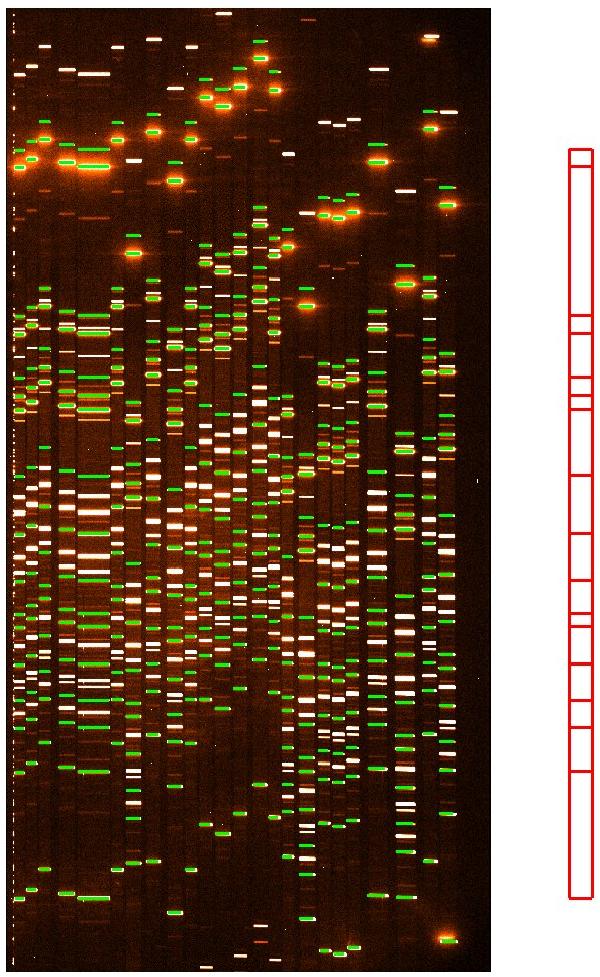
An example of a HeAr arc line catalog displayed on a raw lamp frame (in background) within F-VIPGI. The green regions mark the expected positions of the arc lines according to the information extracted from the fits header while the red ones on the right represent the line catalog used for the calibration. The red part of the spectrum is in the upper part of the image.
Current usage metrics show cumulative count of Article Views (full-text article views including HTML views, PDF and ePub downloads, according to the available data) and Abstracts Views on Vision4Press platform.
Data correspond to usage on the plateform after 2015. The current usage metrics is available 48-96 hours after online publication and is updated daily on week days.
Initial download of the metrics may take a while.