| Issue |
A&A
Volume 550, February 2013
|
|
|---|---|---|
| Article Number | A45 | |
| Number of page(s) | 15 | |
| Section | Planets and planetary systems | |
| DOI | https://doi.org/10.1051/0004-6361/201219841 | |
| Published online | 24 January 2013 | |
AKARI/IRC 18 μm survey of warm debris disks
1
Subaru Telescope, National Astronomical Observatory of Japan,
650 North A’ohoku Place,
Hilo,
HI
96720,
USA
e-mail: This email address is being protected from spambots. You need JavaScript enabled to view it.
2
Graduate School of Science, Nagoya University,
Furo-cho, Chikusa-ku, Nagoya,
464-8602
Aichi,
Japan
3
Department of Astronomy, School of Science, University of
Tokyo, Bunkyo-ku,
113-0033
Tokyo,
Japan
4
Institute of Space and Astronautical Science, Japan Aerospace Exploration Agency,
3-1-1
Yoshinodai, Chuo-ku, Sagamihara, 252-5210
Kanagawa,
Japan
5
National Astronomical Observatory of Japan,
2-21-1 Osawa, Mitaka, 181-0015
Tokyo,
Japan
6
Graduate School of Science, Osaka University,
1-1 Machikaneyama, Toyonaka,
560-0043
Osaka,
Japan
7
Astronomical Institute, Tohoku University,
6-3 Aramaki, Aoba-ku, Sendai,
980-8578
Miyagi,
Japan
8
Research Institute of Science and Technology for Society, Japan
Science and Technology Agency, K’s
Gobancho Bldg 7, Gobancho, Chiyoda-ku, 102-0076
Tokyo,
Japan
9
Departmento Física Teórica, Facultad de Ciencias, Universidad
Autónoma de Madrid, Cantoblanco, 28049
Madrid,
Spain
10
Department of Physics and Astronomy, The Open
University, Walton
Hall, Milton Keynes
MK7 6AA,
UK
11
Space Science & Technology Department, The Rutherford
Appleton Laboratory, Chilton,
Didcot, Oxfordshire
OX11 0QX,
UK
Received: 19 June 2012
Accepted: 21 November 2012
Abstract
Context. Little is known about the properties of the warm (Tdust ≳ 150 K) debris disk material located close to the central star, which has a more direct link to the formation of terrestrial planets than does the low-temperature debris dust that has been detected to date.
Aims. To discover new warm debris disk candidates that show large 18 μm excess and estimate the fraction of stars with excess based on the AKARI/IRC Mid-Infrared All-Sky Survey data.
Methods. We searched for point sources detected in the AKARI/IRC All-Sky Survey, which show a positional match with A-M dwarf stars in the Tycho-2 Spectral Type Catalogue and exhibit excess emission at 18 μm compared to what is expected from the KS magnitude in the 2MASS catalogue.
Results. We find 24 warm debris candidates including 8 new candidates among A-K stars. The apparent debris disk frequency is estimated to be 2.8 ± 0.6%. We also find that A stars and solar-type FGK stars have different characteristics of the inner component of the identified debris disk candidates. While debris disks around A stars are cooler and consistent with steady-state evolutionary model of debris disks, those around FGK stars tend to be warmer and cannot be explained by the steady-state model.
Key words: circumstellar matter / zodiacal dust / infrared: stars
© ESO, 2013
1. Introduction
Some main-sequence stars are known to have dust disks around them. Primordial dust grains that originally exist in protoplanetary disks around T Tauri stars or Herbig Ae/Be stars are dissipated before their central stars reach the main-sequence phase. Therefore the circumstellar dust grains around main-sequence stars should be composed of second-generation dust grains replenished during the main-sequence phase, rather than primordial dust from protoplanetary disks. These second-generation dust grains are thought to have originated in collisions of planetesimals or during the destruction of cometary objects (e.g. Backman & Paresce 1993; Lecavelier Des Etangs et al. 1996), giving the reason circumstellar dust disks around main-sequence stars are named “debris disks.” Debris disks are expected to be related to the stability of minor bodies and, potentially, to the presence of planets around stars (e.g. Wyatt 2008).
Debris disks are identified from the spectral energy distributions (SEDs) of stars that show an excess over their expected photospheric emission at infrared (IR) wavelengths, since circumstellar dust grains absorb the stellar light and re-emit mainly in the IR region. The first example of a debris disk, around Vega, was discovered through its excess emission at wavelengths of ≳60 μm by Infrared Astronomical Satellite (IRAS) in 1980s (Aumann et al. 1984). After the discovery of the Vega debris disk, more than 100 others have been identified from the IRAS catalogue. A number of new debris disk candidates have been discovered recently, even though the IRAS mission flew more than 20 years ago (Rhee et al. 2007). The power of a next-generation all-sky survey satellite mission like AKARI (Murakami et al. 2007) to advance the debris disk search is evident.
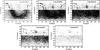 |
Fig. 1 Spatial distributions of A-M dwarf stars from the Tycho-2 Spectral Type Catalogue (Wright et al. 2003). |
Most of the known debris disks only show excess far-infrared (FIR) emission at wavelengths longer than 25 μm. This excess comes from the thermal emission of dust grains with low temperatures (Tdust ~ 100 K), and is an analogue of Kuiper belt objects in the solar system. Recently, Herschel (Pilbratt et al. 2010) has provided FIR data for debris disks with high sensitivity and high spatial resolution and is opening a new horizon of research on cold debris disks (e.g. Thompson et al. 2010). For example, Eiroa et al. (2011) discovered cold (Tdust ≲ 20 K), faint debris disks towards three GK stars, which might be in a new class of the coldest and faintest disks discovered so far around mature stars and which cannot easily be explained by invoking classical debris disk models. In addition, some cold debris disks have been spatially resolved by Herschel (e.g. Löhne et al. 2012; Liseau et al. 2010). On the other hand, little is known to date about the warm (Tdust ≳ 150 K) debris disk material located close to the star, which should be an analogue of the asteroid belt in the solar system. Warm dust grains in the inner region of debris disks should have a more direct link to the formation of terrestrial planets than the low-temperature dust that has been previously studied (Meyer et al. 2008). Recent high-sensitivity surveys at 10−20 μm allow us to investigate the properties of this inner debris disk material.
AKARI is a Japanese IR satellite dedicated primarily to an IR all-sky survey (Murakami et al. 2007). It was launched in February 2006. The Mid-Infrared (MIR) All-Sky Survey was performed using 9 and 18 μm broad band filters with the InfraRed Camera (IRC; Onaka et al. 2007) onboard AKARI until August 2008 (Ishihara et al. 2010), and a complementary FIR survey at 65–160 μm was performed with the Far-Infrared Surveyor (Yamamura et al. 2010). We show that the data from the AKARI/IRC All-Sky Survey is very powerful at identifying warm debris disks and contributing to the number of sample with its higher sensitivity and spatial resolution than those of IRAS.
Here we report initial results of the survey of warm debris disks around main-sequence stars based on the AKARI/IRC All-Sky Survey.
2. 18 μm excess search with AKARI/IRC All-Sky Survey
2.1. Input catalogue: Tycho-2 Spectral Type Catalogue
In this work, we use the Tycho-2 Spectral Type Catalogue (Wright et al. 2003) as an input catalogue. This catalogue lists spectral types for 351864 of the Tycho-2 stars by cross-referencing Tycho-2 to several catalogues that have spectral types: the Michigan Catalogue for the HD Stars, Volumes 1–5 (Houk & Cowley 1975; Houk 1978, 1982; Houk & Smith-Moore 1988; Houk & Swift 1999); the Catalogue of Stellar Spectra Classified in the Morgan-Keenan System (Jaschek et al. 1964); the MK Classification Extension (Kennedy 1996); the Fifth Fundamental Catalogue (FK5) Part I (Fricke et al. 1988) and Part II (Fricke et al. 1991); and the Catalogue of Positions and Proper Motions (PPM), North (Roeser & Bastian 1988) and South (Bastian & Röser 1993), using the VizieR astronomical database1.
We selected stars whose luminosity classes were labelled as “V” (dwarf) from the catalogue to remove giant stars from the sample, since we focus our search for debris disks around main-sequence stars. Since young and massive main-sequence stars, which are commonly known as classical Be stars, sometimes exhibit significant IR excess resulting from free-free emission from circumstellar gas disks, stars whose spectral types were labelled as “O” or “B” in the Tycho-2 Spectral Type Catalogue were excluded from our sample. The selection of A-M dwarfs from the Tycho-2 Spectral Type Catalogue left 64209 stars as an input catalogue for further investigation. Since the V-band limiting magnitude in the Tycho-2 Catalogue is about V = 11.5 (Hog et al. 2000), the distance limit for A0, F0, G0, K0, and M0 dwarfs probed by the Tycho-2 Catalogue is estimated as 1500, 580, 260, 130, and 35 pc, respectively, by assuming no extinction at the V-band.
Summary of debris disk survey at 18 μm.
The spatial distributions of the A-M dwarf stars from the Tycho-2 Spectral Type Catalogue in equatorial coordinates are shown in Fig. 1. Since the information on luminosity classes in the Tycho-2 Spectral Type Catalogue has been adopted mainly from the Michigan Catalogue, which was based on the observations taken at Cerro Tololo Inter-American Observatory with the Michigan Curtis Schmidt telescope, the spatial distribution of the A-M dwarf stars used in this study is unevenly distributed in the southern hemisphere.
2.2. AKARI/IRC Point Source Catalogue
In the AKARI All-Sky Survey, the IRC was operated in the scan mode with a scan speed of 215″ s-1 and the data sampling time of 0.044 s, which provided a spatial sampling of ~ along the scan direction. The pixel scale along the cross-scan direction was ~ by binning four pixels in a row to reduce the data downlink rate (Ishihara et al. 2010). The positional accuracy is improved to ~5″ in both bands by combining the dithered data from multiple observations using the standard AKARI/IRC All-Sky Survey pipeline software (Ishihara et al. 2010). The 5 σ sensitivity for a point source per scan is estimated to be 50 mJy in the S9W band and 90 mJy in the L18W band. The distance limit at which the stellar photosphere can be detected in the L18W band of the AKARI/IRC Point Source Catalogue (PSC) is estimated as 74, 40, 26, 17, and 10 pc for A0, F0, G0, K0, and M0 dwarfs, respectively.
The first version of the AKARI/IRC PSC contains more than 850 000 sources detected at 9 μm and 195 000 sources at 18 μm. The quoted flux density and its uncertainty for a single source were calculated as the average and deviation (root-mean-square) of photometry for multiple detections. Details of the AKARI/IRC All-Sky Survey and its data reduction process are described in Ishihara et al. (2010).
2.3. Cross-correlation
The selected dwarfs from the Tycho-2 Spectral Type Catalogue were cross-correlated against the AKARI/IRC PSC positions. A search radius of 5″ was adopted to take the positional uncertainty in the AKARI/IRC PSC into account. After the results of the cross-correlation, 873 stars out of the input 64209 stars were detected at 18 μm. For the detected stars, we searched for the nearest near-infrared (NIR) counterparts within a search radius of 5″ in the 2MASS All-Sky Catalogue of Point Sources (Cutri et al. 2003) and found 856 stars with 2MASS counterparts. The numbers of stars that were detected with both of AKARI/IRC 18 μm and 2MASS are summarised in Table 1.
2.4. 18 μm excess candidate selection
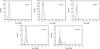 |
Fig. 2 Histogram of the KS − [18] colour of the stars detected at 18 μm for each spectral type star. The results of Gaussian fitting of the histograms are indicated by the dashed lines. The three vertical dotted lines indicate the peak position μKS − [ L18W ] (middle), and 2σ positions (left and right) of the distribution of the KS − [18] colour. |
We made a histogram of the KS−[18] colours of the stars detected at 18 μm for each spectral type and set the KS−[18] colours as an indicator of 18 μm excess. The histograms of the KS−[18] colour are shown in Fig. 2 for each spectral type. Gaussian fitting was performed for the distribution of the KS−[18] colour to determine the thresholds for 18 μm excess detection. The peak position μKS− [L18W] and profile width σKS− [L18W] of the KS−[18] colour in each of the spectral types derived by Gaussian fitting are listed in Table 2. The peak position (μKS− [L18W] ) corresponds to the empirical KS−[18] colours of normal stars. The scatter in the KS−[18] colours (σKS− [L18W] ) is between 0.14 and 0.19 mag. This scatter can be accounted for by the photometric uncertainties in AKARI/IRC and 2MASS. For faint stars with KS ≳ 4 mag, the scatter is dominated by the uncertainty in the AKARI/IRC L18W band photometry, which is mainly by the background noise (<0.2 mag), while the uncertainty in the 2MASS KS-band photometry is smaller than 0.02 mag and does not contribute significantly. For bright stars with KS ≲ 4 mag, the uncertainty in the AKARI/IRC L18W band photometry is small (≲0.05 mag) and the scatter is dominated by the uncertainty in the 2MASS KS-band photometry, which is ~0.1−0.2 mag, since those stars are in the range of partial saturation in the 2MASS observations (Cutri et al. 2003).
Obtained parameters from Gaussian fit.
We set a 2σ-threshold for a positive 18 μm excess detection for each spectral type as defined in Table 2. Sources whose KS−[18] colour is larger than the 2σ-thresholds are selected as 18 μm excess candidates. In the selection of the 18 μm excess candidates, the photometric uncertainties of the individual stars are also taken into account.
A visual inspection of the excess candidates was conducted by comparing AKARI/IRC images with 2MASS and DSS images to confirm that there were no nearby IR sources. During visual inspection, HD 68256 and HD 68257 whose separation is 6″, HD 24071 and HD 24072 whose separation is 4″, HD 94602 and HD 94601 whose separation is 7″, HD 72945 and HD 72946 whose separation is 10″, and HD 147722 and HD 147723 whose separation is 2″, were all found to be unresolved in the AKARI/IRC All-Sky image and could be contaminated by each other. Thus they were excluded from consideration as 18 μm excess candidates. BD+213825 is also found to be contaminated by 2MASS J19334644+2130586, whose separation is 7″, and thus excluded. It should be noted that the contaminating star 2MASS J19334644+2130586 has a significant MIR excess, which was confirmed by our follow-up observations using Subaru/COMICS and Spitzer/IRS. The rejected sources due to the nearby star contamination are listed in Table 3. Although HD 89125 and HD 15407 might be contaminated by the nearby star GJ 387 (separation is 7″) and HIP 11962 (separation is 20″), respectively, the observed excess flux densities at 18 μm are much higher than the expected flux densities of the contaminating sources. We conclude that the 18 μm excesses of HD 89125 and HD 15407 are secure, and we select a final catalogue of 42 stars with 18 μm excess in the Tycho-2 Spectral Type Catalogue.
List of rejected sources.
The 9 μm flux densities of HD 166191, HD 39415, and HD 145263, which were selected from the KS−[18] colours, are not available in the latest version of AKARI/IRC PSC since they were observed by AKARI at 9 μm during a South Atlantic Anomaly (SAA) passage, and thus rejected from the PSC; however, the reliable detections are confirmed in the 9 μm images. We measured the 9 μm flux densities in the images manually. Mouri et al. (2011) investigated the behavior of signals from the MIR detector onboard AKARI in the SAA regions. They find that ionising particle hits affected the detector, leading to changes in the output offset. Therefore the SAA does not significantly affect measurements of point sources in the AKARI/IRC All-Sky Survey data, and therefore the measured flux densities at 9 μm of HD 166191, HD 39415, and HD 145263 are reliable.
2.5. Known YSOs and late-type stars
List of known YSOs and late-type stars detected at 18 μm.
Since we focus on debris disks in this paper, we need to distinguish debris disks from other types of excess emission such as those often seen in young stellar objects (YSOs) or late-type stars. We searched for the attributes of the 42 stars exhibiting 18 μm excess in the SIMBAD database2 and find that 12 stars were classified as YSOs and 6 as late-type stars in the literature. The known YSOs and late-type stars in the 18 μm excess sample are listed in Table 4. The spectral type and luminosity classes in Table 4 were taken from the SIMBAD database, which is supposed to contain the latest information. For stars whose stellar information was revised after the Tycho-2 Spectral Type Catalogue, the spectral type and luminosity class listed in Table 4 may differ from those in the Tycho-2 Spectral Type Catalogue. Thus stars other than luminosity class V have been included. Twenty-four main-sequence stars remain as candidates for debris disks after excluding the known YSOs and late-type stars.
2.6. Photospheric SED fitting and extinction determination
The photospheric flux densities of the KS−[18]-selected candidates were estimated from the Kurucz model (Kurucz 1992) fitted to the 2MASS JHKS-band photometry of the stars taking the extinction in the NIR into account.
We adopted the NIR reddening curve given by Fitzpatrick & Massa (2009), which is a generalisation of the analytic formula given by Pei (1992). For λ ≥ λ0, it has the form  (1)where λ0 = 0.507 μm. Thus, the absolute extinction Aλ/AV is given by
  (2)The ratio of the total-to-selective extinction, RV ≡ A(V)/ E(B − V), and α are free parameters. The NIR observations show that these parameters can vary from one sight line to another. In this work, we use a curve defined by α = 2.05 and RV = 3.11. These parameters provide a good representation of the mean curve determined by Fitzpatrick & Massa (2009) and also of the extinction data taken from the literature for the diffuse interstellar medium in the Milky Way.
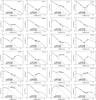 |
Fig. 3 NIR–FIR SED of our debris disk candidates with 18 μm excess. The pluses, filled squares, open circles, crosses, open diamonds, open triangles, and filled circles indicate the photometry with the 2MASS, AKARI/IRC, IRAS, MSX, WISE, ground-based observations (Subaru/COMICS and Gemini/T-ReCS), and Spitzer/MIPS, repectively. We also plot contributions of the photosphere (dashed lines) and those of inner disk component (dotted lines) fitted with AKARI/IRC, IRAS, and Spitzer/MIPS measurements by assuming that the debris dust emits blackbody emission. |
List of debris disk candidates with 18 μm excess.
In our photospheric SED fitting, the scaling factor of luminosity with varying distance and extinction, and the extinction AV are free parameters, while the effective temperature and the surface gravity are inferred from the spectral type. The derived photospheric flux densities at 9 μm and 18 μm for each star are listed in Table 5.
2.7. Selected debris disk candidates
The final catalogue contains 24 AKARI-identified debris disk candidates showing 18 μm excesses. Among these, we identify eight stars (HD 64145, HD 75809, HD 89125, HD 106797, HD 113457, HD 165014, HD 175726, and HD 176137) that are new debris disk candidates, and the excess emission of two stars (HD 15407 and HD 39415), which have never been confirmed following their tentative discovery with IRAS (Oudmaijer et al. 1992), is confirmed by our AKARI survey. The SEDs of the 24 identified debris disk candidates are shown in Fig. 3. We summarise the observed and photospheric flux densities (Fobs and F∗, respectively) and excess significance (χ ≡ (Fobs − F∗)/σ) at 9 and 18 μm of all the candidates in Table 5, where σ is the uncertainty of the excess level calculated from the errors of the AKARI/IRC PSC photometry and in the estimation of the photospheric emission from the 2MASS photometry for each source. Thirteen stars out of the 24 identified debris disk candidates also show excess at 9 μm. It should be noted that since the uncertainty in the flux density for a single source is calculated as the deviation of photometry for multiple detections in the AKARI/IRC PSC, the uncertainty may possibly be too small if the number of detections is small, such as the cases of 18 μm photometry of HD 165014 and HD 166191. The median value of the uncertainty at 18 μm in our debris disk candidates is 0.022 Jy. Therefore the 18 μm excess towards HD 165014 and HD 166191 will still be significant even if we assume the median values as the photometric uncertainties for the two stars.
Stellar parameters of debris disk candidates with 18 μm excess.
We list the stellar parameters (spectral type, stellar mass, luminosity, age, and distance) of all the candidates in Table 6. The spectral types of the stars are all taken from the SIMBAD database. For HD 3003, HD 9672, HD 15407, HD 39060, HD 89125, HD 98800, HD 106797, HD 109573, HD 110058, HD 145263, and HD 181296, we took the stellar masses and luminosities from the literature. For the other stars whose stellar masses and luminosities are unavailable there, we estimated them from their spectral types according to Cox (2000).
3. Additional photometric measurements of debris disk candidates
3.1. Subaru/COMICS and Gemini/T-ReCS follow-up observations
HD 15407, HD 165014, and HD 175726 were observed with the COoled Mid-Infrared Camera and Spectrometer (COMICS; Kataza et al. 2000; Okamoto et al. 2003; Sako et al. 2003) mounted on the 8 m Subaru Telescope in July 2007. Imaging observations at the 8.8 μm (Δλ = 0.8 μm), 11.7 μm (Δλ = 1.0 μm), and 18.8 μm (Δλ = 0.9 μm) bands were carried out. The pixel scale was  pixel-1. To cancel out the background radiation, a secondary-mirror chopping method was used. We used standard stars from Cohen et al. (1999) as a flux calibrator, and determined the reference point-spread functions (PSFs) from the observations. We observed standard stars before or after the observations of the target star in the same manner as the target stars. The parameters of the COMICS observations are summarised in Table A.1.
HD 106797, HD 105209, and HD 110058 were observed with the Thermal-Region Camera Spectrograph (T-ReCS; Telesco et al. 1998), mounted on the 8 m Gemini South Telescope in June 2007. Imaging observations at the 8.8 μm (Δλ = 0.8 μm; Si2), 9.7 μm (Δλ = 0.9 μm; Si3), 10.4 μm (Δλ = 1.0 μm; Si4), 11.7 μm (Δλ = 1.1 μm; Si5), 12.3 μm (Δλ = 1.2 μm; Si6), and 18.3 μm (Δλ = 1.5 μm; Qa) bands were carried out. The pixel scale was  pixel-1. Procedures for the observations were basically the same as for the COMICS observations. The parameters of the T-ReCS observations are summarised in Table A.2.
For the data reduction, we used our own reduction tools and IRAF3. The standard chop-nod pair subtraction and the shift-and-add method in units of 0.1 pixel were employed. We applied an air mass correction by estimating the difference between the target and standard stars in atmospheric absorption using ATRAN (Lord 1992). The difference in the air masses between the target and standard stars was small (≲0.1) in general, and the correction factor in each band was less than 5%.
Summary of Subaru/COMICS photometry.
Summary of Gemini/T-ReCS photometry.
The derived flux densities are summarised in Tables 7 and 8 for the COMICS and T-ReCS targets, respectively. All of them are in good agreement with the flux densities of the AKARI observations taking into account the narrow band widths of filters of the ground-based observations and possible dust features in these spectral ranges (Fujiwara et al. 2009, 2010, 2012b).
3.2. IRAS, MSX, Spitzer, and WISE photometry
IRAS photometry of the debris disk candidates with 18 μm excess.
MSX photometry of the debris disk candidates with 18 μm excess.
We searched for counterparts whose positional offsets were smaller than 1′ in the IRAS (Beichman et al. 1988) Point Source Catalogue (PSC) and Faint Source Catalogue (FSC), and in the MSX6C Infrared Point Source Catalogue (Egan et al. 2003) of the Midcourse Space Experiment (MSX; Price et al. 2001) via VizieR for each debris disk candidate. The results are shown in Tables 9 and 10 for IRAS and MSX, respectively. We also searched for Spitzer/MIPS data from the literature and found those of HD 3003 (Smith et al. 2006) and HD 181269 (Su et al. 2006; Rebull et al. 2008), as shown in Table 11.
Spitzer/MIPS photometry of the debris disk candidates with 18 μm excess.
WISE photometry of the debris disk candidates with 18 μm excess.
Recent all-sky observations in the MIR by the Wide-field Infrared Survey Explorer (WISE) provided the All-Sky Source Catalogue (Cutri et al. 2012), which is similar to AKARI/IRC PSC and is worth comparing. We searched for counterparts of our MIR excess stars whose positional offsets were smaller than 5″ in the catalogue for comparison. The results are shown in Table 12. All of our debris disk candidates with 18 μm excesses have a counterpart in the WISE All-Sky Source Catalogue.
4. Results and discussion
4.1. Debris disk frequency
The derived apparent debris disk frequency (the fraction of the debris disk candidates in those stars detected at 18 μm in the AKARI/IRC All-Sky Survey) in our sample is summarised in Table 1. We find an overall apparent debris disk frequency of 2.8 ± 0.6% (24/856). The apparent debris disk frequency for A, F, G, K, and M stars is estimated to be 5.6 ± 1.6% (11/196), 3.1 ± 1.0% (10/324), 1.2 ± 0.8% (2/173), 0.7 ± 0.7% (1/144), and 0.0% (0/19), respectively. Since it is limited by the sensitivity of the AKARI/IRC All-Sky Survey, the sample is biased towards stars exhibiting MIR excess. To estimate the debris fraction properly, we count only the excess sample whose photosphere would be detectable at 18 μm with the AKARI/IRC All-Sky Survey (i.e. F∗,18 ≳ 90 mJy; HD 3003, HD 39060, HD 64145, HD 75809, HD 89125, HD 123356, HD 175726, HD 176137, and HD 181296) among 18 μm-detected sources with detectable photosphere, and calculate the “real” debris disk frequency relative to those with F∗,18 ≳ 90 mJy. We find an overall debris disk frequency of 1.1 ± 0.4% (9/856). The debris disk frequency for A, F, G, K, and M stars is derived as 2.2 ± 1.1% (4/178), 1.0 ± 0.6% (3/311), 1.2 ± 0.8% (2/169), 0.0% (0/144), and 0.0% (0/19), respectively, suggesting a possible tendency to increase in the debris disk frequency towards earlier type stars. The statistics of the debris disk frequency is summarised in Table 1.
The excess rates at 24 μm by Spitzer/MIPS observations for A stars and solar-type FGK stars are 32% (52/160) (Su et al. 2006) and 6% (5/82) (Beichman et al. 2006), respectively. Therefore the debris disk frequency derived in this work is much lower than those estimated by Spitzer/MIPS observations for both A and FGK stars. It should be noted that the uncertainty in Spitzer/MIPS pointed observations is smaller than the present catalogue of the AKARI/IRC All-Sky Survey, and thus Spitzer/MIPS observations detect fainter excess than this work. Our thresholds for 18 μm excess detection for the AKARI/IRC sample in this study are shown in Table 2, which can potentially detect a debris disk star with 18 μm excess of Fobs,18/F∗,18 ≳ 1.4. If we take a debris disk sample with 24 μm excess from the Spitzer/MIPS sample with the same threshold (Fobs,24/F∗,24 ≳ 1.4) as set for the AKARI/IRC sample in this work, the frequency becomes 14% (22/160) for A stars and 1% (1/82) for FGK. The debris disk frequency of FGK stars in this work is derived as 0.8 ± 0.3% (5/624), which is consistent with the Spitzer/MIPS work (Beichman et al. 2006). On the other hand, the frequency of A stars in this work is still lower than that of the Spitzer/MIPS work (Su et al. 2006) even after considering the difference in the excess detection threshold. The difference might come from a selection effect of the input stars. We select only dwarf A stars from the Tycho-2 Spectral Type Catalogue, while the Su et al. (2006) sample includes a number of very young star (age <10 Myr) and late B stars, which show excess more frequently.
The frequency of debris disks around M stars in this work is derived as 0.0% (0/19). Although the only known M-type debris disk AU Mic is detected with IRC with 1.08 ± 0.01 and 0.25 ± 0.02 Jy at 9 and 18 μm, respectively, no MIR excess is found towards the star. The non-detection of excess at 9 and 18 μm around AU Mic is consistent with MIR observations with Spitzer (e.g. Chen et al. 2005).
4.2. Characteristics of selected debris disk candidates
4.2.1. MIR colour, inner temperature, and inner radius
Estimating the dust temperature is important for inferring the radial structures of debris disks. MIR observations are particularly useful for tracing the temperature of the hottest inner region of debris disks. We derived the dust temperature from the 9 to 18 μm colours of the observed excess emission for each star by assuming that the debris dust emits blackbody emission. This temperature is supposed to correspond to the dust temperature (Tin) at the inner radius (Rin) of the debris disk.
Inner temperature and radius of debris disk candidates with 18 μm excess.
In the case where excess emission at 9 μm was not detected with AKARI/IRC, the dust temperature should be lower than the temperature for those that show excess at 9 μm. For the sources whose 9 μm excess was not detected with AKARI/IRC and where an excess at the wavelengths of λ ≳ 24 μm was reported by IRAS or Spitzer observations, we derived the dust temperature from blackbody fitting to the observed excess emission at λ ≳ 24 μm. In the case where excesses at 9 μm and at ≳24 μm were not detected with AKARI/IRC, IRAS, and Spitzer, we set an upper limit of Tin at 170 K, which is the highest possible temperature of the coldest debris disk with 9 and 18 μm excess in the sample ( for HD 109573). We also derived the inner radius of debris disk (Rin) as
  (3)where L∗ and σSB is the stellar luminosity and the Stefan-Boltzmann constant, respectively. The derived MIR colour, Tin, and Rin are listed in Table 13.
The inner temperature Tin of A stars range from ≲100 K to ~330 K and the inner radius Rin from ~5 AU to >20 AU. The median value of the inner temperature among A stars is ≲170 K. On the other hand, Tin and Rin of solar-type FGK stars range from ≲170 K to ~500 K and from <1 AU to ≳5 AU, respectively. The median value of the inner temperature among FGK stars is ~350 K, much higher than that of A stars. This suggests that the origin of the observed MIR excess is different between A and FGK stars: while the MIR excess emission of A stars in our sample is typically contributed from the Wien-side tail of the emission from the cool debris material, that of FGK stars originates in the emission from the inner warm debris material.
4.2.2. Lack of cooler material in outer region
The flux contributed from the inner dust for each star is shown in Fig. 3. The excess component of our samples, except for HD 109573, HD 121617, and HD 166191, can be fitted fairly well solely with the inner dust component of a single blackbody. This implies the lack of cooler material in the outer region around those stars and truncation of the disk at inner radii, although FIR and sub-mm observations with high sensitivity are required to accurately investigate the presence of the outer material. Only one object (HD 166191) shows a rising SED towards 60 μm among our 13 FGK-type samples, while about half of the samples of 11 A-type stars show FIR excess, suggesting that the solar-type stars in our sample tend to have less cooler material in the outer region than A stars.
Rhee et al. (2007) suggests that the dust temperature in typical debris disks discovered with IRAS observations is less than 100 K, and the peak of the excess flux density comes to around 60−100 μm. However, most of the debris disks detected by AKARI/IRC in this work have abundant warm dust, while cooler material in the outer regions is not conspicuous, suggesting that we detect a sub-group of the debris disks in which warm dust grains are more abundant than in debris disks detected by IRAS. Special mechanisms, such as dust trapping by the resonance perturbation of planets or generation of a large amount of warm dust, might play significant roles in the inner region of disks in these systems.
4.2.3. Fractional luminosity of inner disk
Estimating the amount of dust is important to characterising the debris disk. One of the observable indicators of the dust abundance is its fractional luminosity, f = Ldust/L∗, i.e., the IR luminosity from the disk divided by the stellar luminosity. We derive the fractional luminosities (fobs) of the inner debris disk by integrating the intrinsic stellar emission and the observed excess emission of the inner debris component. The derived fractional luminosities are shown in Table 13. It should be noted that the fractional luminosities for the inner disks with the cold dust component should be regarded as upper limits, since we do not consider the contribution from the cold dust. The derived fractional luminosities range from ~10-4 to ~10-1. The fractional luminosity of our own zodiacal cloud is estimated to be ~10-7 (Backman & Paresce 1993). Thus the debris disks in our sample are typically brighter by more than 1000 times than our own zodiacal cloud.
Wyatt et al. (2007a) has developed a simple model for the steady-state evolution of debris disks produced by collisions and suggests that the maximum fractional luminosity (fmax) can be written by  (4)for the fixed model parameters (belt width: dr/r = 0.5; planetesimal strength:
  J/kg; planetesimal eccentricity: e = 0.05; and diameter of the largest planetesimal in cascade: Dc = 2000 km). The values of fmax were calculated using the parameters of the central star listed in Table 6 and the estimated parameters for the inner disk component in Table 13.
Comparison of observed (fobs) and theoretical fractional luminosities (fmax) for our debris disk sample whose age is available.
The ratios of the observed fractional luminosities to the theoretical maximum fractional luminosities (fobs/fmax) are summarised in Table 14. Some debris disks show fractional luminosities of fobs/fmax ≫ 100, suggesting that these debris disks cannot be accounted for by simple models of the steady-state debris disks, and that transient events likely play a significant role, even if taking the uncertainties in the models (Wyatt et al. 2007a) into account.
One of the transient phenomena producing a large amount of debris dust around a star is a dynamical instability that scatters planetesimals inward from a more distant planetesimal belt. Dust is released from unstable planetesimals following collisions and sublimation. This is akin to the late heavy bombardment (LHB) in the solar system, the cataclysmic event that occurred about 700 Myr after the initial formation of the solar system, as implied by the Moon’s cratering record (e.g. Hartmann et al. 2000).
To develop an LHB-like event around a star, a newly born planet would have to migrate and stir up planetesimals. Since planet formation is expected to last for several hundred Myr around solar-type stars, LHB-like events could be the cause of dense warm debris disks around the young (age ≲Gyr) FGK systems of HD 113766, HD 145263, and HD 98800. On the other hand, HD 89125, HD 15407, and HD 175726 are older than one Gyr, and planet formation is expected to have already been finished, therefore another dust production mechanism would be required to account for the large fractional luminosities of HD 89125, HD 15407, and HD 175726. It is worth noting that recent FIR observations of HD 15407 by Herschel and AKARI have revealed the absence of cold dust around the star, not supporting an LHB-like event as the origin of the bright debris disk around the star (Fujiwara et al. 2012a).
4.2.4. Difference between A and FGK stars
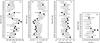 |
Fig. 4 Distributions of Tin (a), Rin (b), fractional luminosity (c), and fobs / fmax (d). Filled and open squares indicate the stars with and without 9 μm excess, respectively. We set Tin at 170 K for the stars without 9 μm excess and photometric information at λ ≳ 24 μm. |
To investigate the relationship between the debris disks and the spectral type of the central stars, we plot the distributions of Tin, Rin, fractional luminosity, and fobs/fmax sorting by the spectral types in Fig. 4. It is seen that all of the debris disks investigated here change their characteristics appreciably around the spectral type F0; Tin ≲ 200 K for A stars, while Tin ≳ 300 K for FGK stars; Rin ≳ a few AU for A stars, while Rin ≲ a few AU for FGK stars; the fractional luminosities for A stars are distributed around 10-5−10-3, while those for FGK stars are in a range 10-3−10-1; and fobs/fmax for A stars is distributed around unity, while that for FGK stars is ≳100. In other words, the properties of the inner disks of A and FGK stars are different from each other. Most of our debris disk samples around FGK stars possess warm dust without an appreciable amount of cooler dust, while those debris disks with 18 μm excesses around A stars show little excess at 9 μm. Our debris disk samples around FGK stars may belong to a sub-group of the debris disks in which violent dust supply is taking place in the inner region (≲ a few AU) of the disk.
Radiation pressure is capable of removing dust grains and changing the radial distribution of dust. When the radiation-pressure-to-gravity ratio β = Frad/Fgrav becomes greater than unity, the outward force dominates and the dust grains are blown out. The ratio β can be approximated by  (5)where D is the grain size, ρ is the grain density, and L∗ and M∗ are in units of L⊙ and M⊙ (Burns et al. 1979). For μm-sized (D ~ 1 μm) silicate (ρ ~ 2.7 g/cm3) grains, β becomes about unity around an F0 star (M∗ = 1.6M⊙ and L∗ = 4.1 L⊙). Therefore μm-sized grains may be blown out by radiation pressure in the vicinity of A stars, while they can survive in FGK stars.
Morales et al. (2009) observed 52 main-sequence A and late B type stars with the Spitzer/IRS that showed excess emission at 24 μm in the Spitzer/MIPS observations. They found no prominent spectral features evident in any of the spectra, suggesting that fine particles that show spectral features are absent around early-type stars.
By taking the estimated β value and the absence of small dust grains around early-type stars into account, it is suggested that μm-sized grains are blown out by radiation pressure from A stars and that the difference in the disk characteristics between A and FGK stars seen in our sample may be driven by the radiation pressure on grains.
4.3. Individual stars
Here we present notes about the individual debris disk candidates with 18 μm excess discovered with AKARI or confirmed in this work for the first time after the report by Oudmaijer et al. (1992).
4.3.1. HD 15407
HD 15407 is an F3V star at d = 55 pc, whose IR excess was originally suggested by Oudmaijer et al. (1992) and confirmed by our present AKARI study. The SIMBAD database indicates HD 15407 is a star in double system with the nearby K2V star HIP 11692 (HD 15407B) with the apparent separation of  . In this paper we refer to the primary star (frequently called as HD 15407A) simply as HD 15407. HD 15407 star may be mature, and the age is estimated as 2.1 Gyr by Holmberg et al. (2009). On the other hand, a recent paper (Melis et al. 2010) suggests a much younger age (~80 Myr) based on the lithium 6710 Å absorption and the motion in the Galaxy. This star is one of the most peculiar debris disk candidates in our sample since the fractional luminosity is much higher than the steady-state evolution model of planetesimals (fobs/fmax > 105). In addition, abundant silica (SiO2) dust, which is a rare dust species in the universe, is seen in the Spitzer/IRS spectrum (Fujiwara et al. 2012b; Olofsson et al. 2012). Special mechanisms to generate a large amount of peculiar dust play a significant role around the star.
4.3.2. HD 39415
HD 39415 is an F5V star, whose IR excess was originally suggested by Oudmaijer et al. (1992) and confirmed with our present AKARI study. No age information is available at present. Holmes et al. (2003) report non-detection of sub-mm emission at 870 and 1300 μm (3σ limits are 18.75 and 10.68 mJy at 870 and 1300 μm, respectively) with the Heinrich Hertz Telescope at the Submillimeter Telescope Observatory, suggesting that the amount of cool material around the star, if any, is quite small.
4.3.3. HD 64145
HD 64145 is an A3V star at d = 78 pc, whose 18 μm excess is found in this AKARI sample. No age information is available at present. This star is reported as a binary system with a secondary on a 582-day orbit (e.g. Abt 2005). Although no excess at 9 μm is detected with the AKARI/IRC measurements, the IRAS 12 μm flux density is slightly higher than the photospheric level. Since the inner radius of the disk is derived as Rin ~ 17 AU and thus an apparent separation of  is expected, an extended disk structure might be resolved spatially in the scattered light with a high-contrast coronagraph with adaptive optics on 8–10 m class ground-base telescopes. It should be noted that this star is contained in the WISE All-Sky Source Catalogue (Cutri et al. 2012) as J075329.80+264556.5. The flux density at 22 μm (W4 band) is estimated as ~130 mJy in the WISE All-Sky Source Catalogue and is consistent with the expected photoshperic level, suggesting no significant excess at 22 μm. Photometries with narrow/intermediate filters at around 20 μm are required for examination of the inconsistency in the flux density between AKARI and WISE.
4.3.4. HD 75809
HD 75809 is an F3V star, whose 18 μm excess is found in this AKARI sample. No age information is available at present. No 9 μm excess is found with the AKARI observations, suggesting that the temperature of the debris disk is at the lowest end amongst our samples.
4.3.5. HD 89125
HD 89125 is a nearby F8V star at d = 23 pc, whose 18 μm excess is found in this AKARI sample. This star is mature and the age is estimated as 6.5 Gyr (Takeda 2007). The fractional luminosity of the star is much higher than the steady-state evolution model of planetesimals (fobs/fmax > 500), suggesting that transient dust production events might play a significant role around the star. It should be noted that the star is reported as being metal poor ([Fe/H] = −0.39) and as one of the most metal-poor debris systems among the known sample (Beichman et al. 2006). This star is contained in the WISE All-Sky Source Catalogue (Cutri et al. 2012) as J101714.20+230621.6. The flux density at 22 μm (W4 band) is estimated as ~140 mJy in the WISE All-Sky Source Catalogue and is consistent with the expected photoshperic level, suggesting there is no significant excess at 22 μm. Photometry with narrow/intermediate filters at around 20 μm is required for examining the inconsistency.
4.3.6. HD 106797
HD 106797 is an A0V star at d = 99 pc, whose 18 μm excess is found in this AKARI sample. de Zeeuw et al. (1999) classified HD 106797 as a member of Lower Centaurus Crux group, whose age is estimated as 10−20 Myr. Fujiwara et al. (2009) suggests there are narrow spectral features between 11 and 12 μm, which are attributable to (sub-)μm-sized crystalline silicates based on the multi-band photometric data collected in the follow-up observations with Gemini/T-ReCS.
4.3.7. HD 113457
HD 113457 is an A0V star at d = 95 pc, whose 18 μm excess is found in this AKARI sample. de Zeeuw et al. (1999) classifies HD 113457 as a member of Lower Centaurus Crux group, whose age is estimated as 10−20 Myr. Since the inner radius of the disk is estimated to be Rin ~ 22 AU and thus an apparent separation of  is expected, an extended disk structure might be resolved spatially in the scattered light with a high contrast coronagraph with adaptive optics.
4.3.8. HD 165014
HD 165014 is an F2V star, whose 9 and 18 μm excesses are found in this AKARI sample. No age information is available at present. This star was also detected at 8–14 μm with MSX, and possible excesses at the wavelengths have been suggested by Clarke et al. (2005). Strong dust features attributable to crystalline enstatite (MgSiO3) are seen in its Spitzer/IRS spectrum (Fujiwara et al. 2010), while features of crystalline forsterite (Mg2SiO4), which is typically more abundant around young stars, are not seen. Possible formation of enstatite dust from differentiated parent bodies is suggested according to the solar system analogue. Special mechanisms to generate a large amount of crystalline enstatite dust must play a role around the star (Fujiwara et al. 2010).
4.3.9. HD 175726
HD 175726 is a nearby G6V star at d = 27 pc, whose 18 μm excess is found in this AKARI sample. The stellar age is estimated as 4.8 ± 3.5 Gyr by Bruntt (2009). The fractional luminosity is higher than the steady-state evolution model of planetesimals (fobs/fmax > 103), suggesting that some transient dust production events play a role around the star. Since the stellar age is in a range during which LHB took place in the solar system, the bright debris disk around HD 175726 might have been produced by an LHB-like phenomenon. It should be noted that this star is contained in the WISE All-Sky Source Catalogue (Cutri et al. 2012) as J185637.17+041553.6. Although the flux density at 22 μm (W4 band) is estimated as ~110 mJy in the WISE Catalogue and suggests excess at this wavelength, it is considerably lower than the AKARI measurement at 18 μm. The discrepancy may suggest temporal variability of MIR excess towards HD 175726 over a few years. A recent study reveals a dramatic decrease in the infrared excess seen in one of the warm dust debris candidates, the young Sun-like star TYC 8241-2652-1, in several years, which suggests removal of warm debris from the system on a very short time scale (Melis et al. 2012). Monitoring observations of HD 175726 around 20 μm could reveal the nature and evolution of its debris system. The star is a CoRoT asteroseismic target, and the presence of weak solar-like oscillations is reported (Mosser et al. 2009) while no hint of planets orbiting the star has so far been suggested.
4.3.10. HD 176137
HD 176137 is an F5 star, whose 18 μm excess is found in this AKARI sample. No age information is available at present. It is located in the direction towards a highly obscured region in the Galaxy, whose interstellar extinction is estimated as AV = 27.1 by “Galactic Dust Reddening and Extinction” at the IRSA4. The extinction towards the star derived from our fitting procedure of photosphere is AV = 13.0, much less than the estimated extinction, suggesting that the star is located near us. HD 176137 is a double-star system with a separation of  –1″ (at the epoch of 1910−2009) as resolved by speckle interferometry (Douglass et al. 2000). The nature of the nearby star is not known well enough. Ground-based MIR observations of the star with high spatial resolution are needed for further discussion of the possible confusion in the excess from the nearby star.
5. Summary
We have reported the results of a systematic survey of warm (T ≳ 150 K) debris disks based on photometric measurements at 18 μm take from the AKARI/IRC All-Sky Survey data. We have found 24 debris disk candidates with bright MIR excess emission above the stellar photospheric emission out of the 856 sources that were detected at 18 μm. Among them, eight stars are newly discovered in this work. We found that 13 stars out of the 24 debris disk candidates also show excess emission at 9 μm. The overall apparent debris disk frequency is derived as 2.8 ± 0.6% for our sample. We identified a tendency for the frequency to increase towards earlier type stars.
The temperature, radius, and fractional luminosity of the inner disk component of the candidates were derived from the 9 to 18 μm flux densities of the excess emission sources. We find that A stars and solar-type FGK stars have different characteristics of their debris disks; most of those around FGK stars possess warm dust without any cool dust component, while the debris disks around A stars show little evidence of any excess at 9 μm and appear to have lower temperature (T ≲ 200 K) debris dust. In addition, considering only the objects for which the age information is available, we find that the fractional luminosities of the inner debris disks around FGK stars cannot be explained by steady-state evolutionary models of debris disks that are sustained by collisions of planetesimals. On the other hand, the debris disks we have detected around A stars are found to fit the steady-state model well. We propose that the debris disks around FGK stars belong to a sub-group of debris disks, in which violent dust supply and processing are taking place in the inner region (≲ a few AU) of the disk. The suggested difference in the debris disk characteristics between A and solar-type FGK stars can be explored by the next version of the AKARI/IRC PSC and the data from WISE, which will dramatically improve the sensitivity of MIR photometry and should allow us to study a larger population of these very interesting objects.
IRAF is distributed by the National Optical Astronomy Observatory, which is operated by the Association of Universities for Research in Astronomy (AURA) under cooperative agreement with the National Science Foundation.
Acknowledgments
This research is based on observations with AKARI, a JAXA project with the participation of ESA, and on data collected at the Subaru Telescope and the Gemini Observatory. It has made use of the SIMBAD database and the VizieR catalogue access tool, CDS, Strasbourg, France and the data products from 2MASS. H.F. and S.T. was financially supported by the Japan Society for the Promotion of Science (JSPS). We thank the anonymous referee for his/her useful comments. This work was supported by KAKENHI (07J02823 and 23103002) and by the JSPS Institutional Program for Young Researcher Overseas Visits.
References
- Abia, C., de Laverny, P., Recio-Blanco, A., et al. 2009, PASA, 26, 351 [NASA ADS] [CrossRef] [Google Scholar]
- Abt, H. A. 2005, ApJ, 629, 507 [NASA ADS] [CrossRef] [Google Scholar]
- Acke, B., Min, M., van den Ancker, M. E., et al. 2009, A&A, 502, L17 [NASA ADS] [CrossRef] [EDP Sciences] [Google Scholar]
- Aumann, H. H., Beichman, C. A., Gillett, F. C., et al. 1984, ApJ, 278, L23 [NASA ADS] [CrossRef] [Google Scholar]
- Backman, D. E., & Paresce, F. 1993, in Protostars and Planets III, eds. E. H. Levy, & J. I. Lunine, 1253 [Google Scholar]
- Bastian, U., & Röser, S. 1993, Catalog of Positions and Proper Motions: South (Heidelberg: Astron. Rechen Inst.) [Google Scholar]
- Beichman, C. A., Neugebauer, G., Habing, H. J., Clegg, P. E., & Chester, T. J. (eds.) 1988, in Infrared astronomical satellite (IRAS) catalogs and atlases. Explanatory supplement, 1 [Google Scholar]
- Beichman, C. A., Bryden, G., Stapelfeldt, K. R., et al. 2006, ApJ, 652, 1674 [NASA ADS] [CrossRef] [Google Scholar]
- Bruntt, H. 2009, A&A, 506, 235 [NASA ADS] [CrossRef] [EDP Sciences] [Google Scholar]
- Burns, J. A., Lamy, P. L., & Soter, S. 1979, Icarus, 40, 1 [NASA ADS] [CrossRef] [Google Scholar]
- Chen, C. H., Patten, B. M., Werner, M. W., et al. 2005, ApJ, 634, 1372 [NASA ADS] [CrossRef] [Google Scholar]
- Clarke, A. J., Oudmaijer, R. D., & Lumsden, S. L. 2005, MNRAS, 363, 1111 [NASA ADS] [CrossRef] [Google Scholar]
- Cohen, M., Walker, R. G., Carter, B., et al. 1999, AJ, 117, 1864 [NASA ADS] [CrossRef] [Google Scholar]
- Cox, A. N. 2000, Allen’s astrophysical quantities (London: Athlon Press) [Google Scholar]
- Crifo, F., Vidal-Madjar, A., Lallement, R., Ferlet, R., & Gerbaldi, M. 1997, A&A, 320, L29 [NASA ADS] [Google Scholar]
- Cutri, R. M., Skrutskie, M. F., van Dyk, S., et al. 2003, 2MASS All Sky Catalog of point sources [Google Scholar]
- Cutri, R. M., Wright, E. L., Conrow, T., et al. 2012, Explanatory Supplement to the WISE All-Sky Data Release Products, Tech. Rep. [Google Scholar]
- de Zeeuw, P. T., Hoogerwerf, R., de Bruijne, J. H. J., Brown, A. G. A., & Blaauw, A. 1999, AJ, 117, 354 [NASA ADS] [CrossRef] [Google Scholar]
- Douglass, G. G., Mason, B. D., Rafferty, T. J., Holdenried, E. R., & Germain, M. E. 2000, AJ, 119, 3071 [NASA ADS] [CrossRef] [Google Scholar]
- Egan, M. P., Price, S. D., Kraemer, K. E., et al. 2003, VizieR Online Data Catalog, V/114 [Google Scholar]
- Eiroa, C., Marshall, J. P., Mora, A., et al. 2011, A&A, 536, L4 [NASA ADS] [CrossRef] [EDP Sciences] [Google Scholar]
- Fitzpatrick, E. L., & Massa, D. 2009, ApJ, 699, 1209 [NASA ADS] [CrossRef] [Google Scholar]
- Fricke, W., Schwan, H., Lederle, T., et al. 1988, Veroeffentlichungen des Astronomischen Rechen-Instituts Heidelberg, 32, 1 [NASA ADS] [Google Scholar]
- Fricke, W., Schwan, H., Corbin, T., et al. 1991, Veroeffentlichungen des Astronomischen Rechen-Instituts Heidelberg, 33, 1 [NASA ADS] [Google Scholar]
- Fujiwara, H., Yamashita, T., Ishihara, D., et al. 2009, ApJ, 695, L88 [NASA ADS] [CrossRef] [Google Scholar]
- Fujiwara, H., Onaka, T., Ishihara, D., et al. 2010, ApJ, 714, L152 [NASA ADS] [CrossRef] [Google Scholar]
- Fujiwara, H., Onaka, T., Takita, S., et al. 2012a, ApJ, 759, L18 [NASA ADS] [CrossRef] [Google Scholar]
- Fujiwara, H., Onaka, T., Yamashita, T., et al. 2012b, ApJ, 749, L29 [NASA ADS] [CrossRef] [Google Scholar]
- Gielen, C., van Winckel, H., Min, M., Waters, L. B. F. M., & Lloyd Evans, T. 2008, A&A, 490, 725 [NASA ADS] [CrossRef] [EDP Sciences] [Google Scholar]
- Hartmann, W. K., Ryder, G., Dones, L., & Grinspoon, D. 2000, in The Time-Dependent Intense Bombardment of the Primordial Earth/Moon System, eds R. M. Canup, K. Righter et al. (Tucson: University of Arizona Press), 493 [Google Scholar]
- Hernández, J., Calvet, N., Hartmann, L., et al. 2005, AJ, 129, 856 [NASA ADS] [CrossRef] [Google Scholar]
- Holmberg, J., Nordström, B., & Andersen, J. 2009, A&A, 501, 941 [NASA ADS] [CrossRef] [EDP Sciences] [Google Scholar]
- Holmes, E. K., Butner, H. M., Fajardo-Acosta, S. B., & Rebull, L. M. 2003, AJ, 125, 3334 [NASA ADS] [CrossRef] [Google Scholar]
- Honda, M., Kataza, H., Okamoto, Y. K., et al. 2004, ApJ, 610, L49 [NASA ADS] [CrossRef] [Google Scholar]
- Houk, N. 1978, Michigan Catalog of Two-dimensional Spectral Types for HD Stars, 2 (Ann Arbor: Univ. Michigan Dept. Astron.) [Google Scholar]
- Houk, N. 1982, Michigan Catalog of Two-dimensional Spectral Types for HD Stars, 3 (Ann Arbor: Univ. Michigan Dept. Astron.) [Google Scholar]
- Houk, N., & Cowley, A. P. 1975, Michigan Catalog of Two-dimensional Spectral Types for HD Stars, 1 (Ann Arbor: Univ. Michigan Dept. Astron.) [Google Scholar]
- Houk, N., & Smith-Moore, M. 1988, Michigan Catalog of Two-dimensional Spectral Types for HD Stars, 4 (Ann Arbor: Univ. Michigan Dept. Astron.) [Google Scholar]
- Houk, N., & Swift, C. 1999, Michigan Catalog of Two-dimensional Spectral Types for HD Stars, 5 (Ann Arbor: Univ. Michigan Dept. Astron.) [Google Scholar]
- Ishihara, D., Onaka, T., Kataza, H., et al. 2010, A&A, 514, A1 [NASA ADS] [CrossRef] [EDP Sciences] [Google Scholar]
- Jaschek, C., Conde, H., & de Sierra, A. C. 1964, Observatory Astronomical La Plata Series Astronomies, 28, 1 [NASA ADS] [Google Scholar]
- Josselin, E., Loup, C., Omont, A., et al. 1998, A&AS, 129, 45 [NASA ADS] [CrossRef] [EDP Sciences] [Google Scholar]
- Kataza, H., Okamoto, Y., Takubo, S., et al. 2000, in SPIE Conf. Ser. 4008, eds. M. Iye, & A. F. Moorwood, 1144 [Google Scholar]
- Kennedy, P. M. 1996, VizieR Online Data Catalog, III/078 [Google Scholar]
- Kurucz, R. L. 1992, in 149, in The Stellar Populations of Galaxies, eds. B. Barbuy, & A. Renzini, IAU Symp., 225 [Google Scholar]
- Lecavelier Des Etangs, A., Vidal-Madjar, A., & Ferlet, R. 1996, A&A, 307, 542 [NASA ADS] [Google Scholar]
- Liseau, R., Eiroa, C., Fedele, D., et al. 2010, A&A, 518, L132 [NASA ADS] [CrossRef] [EDP Sciences] [Google Scholar]
- Löhne, T., Augereau, J.-C., Ertel, S., et al. 2012, A&A, 537, A110 [NASA ADS] [CrossRef] [EDP Sciences] [Google Scholar]
- Lord, S. D. 1992, A new software tool for computing Earth’s atmospheric transmission of near- and far-infrared radiation, Tech. Rep. [Google Scholar]
- Manoj, P., Bhatt, H. C., Maheswar, G., & Muneer, S. 2006, ApJ, 653, 657 [NASA ADS] [CrossRef] [Google Scholar]
- Melis, C., Zuckerman, B., Rhee, J. H., & Song, I. 2010, ApJ, 717, L57 [NASA ADS] [CrossRef] [Google Scholar]
- Melis, C., Zuckerman, B., Rhee, J. H., et al. 2012, Nature, 487, 74 [Google Scholar]
- Meyer, M. R., Carpenter, J. M., Mamajek, E. E., et al. 2008, ApJ, 673, L181 [NASA ADS] [CrossRef] [Google Scholar]
- Montesinos, B., Eiroa, C., Mora, A., & Merín, B. 2009, A&A, 495, 901 [NASA ADS] [CrossRef] [EDP Sciences] [Google Scholar]
- Morales, F. Y., Werner, M. W., Bryden, G., et al. 2009, ApJ, 699, 1067 [NASA ADS] [CrossRef] [Google Scholar]
- Mosser, B., Michel, E., Appourchaux, T., et al. 2009, A&A, 506, 33 [NASA ADS] [CrossRef] [EDP Sciences] [Google Scholar]
- Mouri, A., Kaneda, H., Ishihara, D., et al. 2011, PASP, 123, 561 [NASA ADS] [CrossRef] [Google Scholar]
- Murakami, H., Baba, H., Barthel, P., et al. 2007, PASJ, 59, 369 [Google Scholar]
- Okamoto, Y. K., Kataza, H., Yamashita, T., et al. 2003, in SPIE Conf. Ser. 4841, eds. M. Iye, & A. F. M. Moorwood, 169 [Google Scholar]
- Olofsson, J., Juhász, A., Henning, T., et al. 2012, A&A, 542, A90 [NASA ADS] [CrossRef] [EDP Sciences] [Google Scholar]
- Onaka, T., Matsuhara, H., Wada, T., et al. 2007, PASJ, 59, 401 [NASA ADS] [Google Scholar]
- Oudmaijer, R. D., van der Veen, W. E. C. J., Waters, L. B. F. M., et al. 1992, A&AS, 96, 625 [NASA ADS] [Google Scholar]
- Pei, Y. C. 1992, ApJ, 395, 130 [NASA ADS] [CrossRef] [Google Scholar]
- Pilbratt, G. L., Riedinger, J. R., Passvogel, T., et al. 2010, A&A, 518, L1 [CrossRef] [EDP Sciences] [Google Scholar]
- Price, S. D., Egan, M. P., Carey, S. J., Mizuno, D. R., & Kuchar, T. A. 2001, AJ, 121, 2819 [NASA ADS] [CrossRef] [Google Scholar]
- Rebull, L. M., Stapelfeldt, K. R., Werner, M. W., et al. 2008, ApJ, 681, 1484 [NASA ADS] [CrossRef] [Google Scholar]
- Rhee, J. H., Song, I., Zuckerman, B., & McElwain, M. 2007, ApJ, 660, 1556 [NASA ADS] [CrossRef] [MathSciNet] [Google Scholar]
- Roeser, S., & Bastian, U. 1988, A&AS, 74, 449 [NASA ADS] [Google Scholar]
- Sako, S., Okamoto, Y. K., Kataza, H., et al. 2003, PASP, 115, 1407 [NASA ADS] [CrossRef] [Google Scholar]
- Schütz, O., Meeus, G., Sterzik, M. F., & Peeters, E. 2009, A&A, 507, 261 [NASA ADS] [CrossRef] [EDP Sciences] [Google Scholar]
- Sloan, G. C., & Price, S. D. 1998, ApJS, 119, 141 [NASA ADS] [CrossRef] [Google Scholar]
- Smith, P. S., Hines, D. C., Low, F. J., et al. 2006, ApJ, 644, L125 [NASA ADS] [CrossRef] [Google Scholar]
- Su, K. Y. L., Rieke, G. H., Stansberry, J. A., et al. 2006, ApJ, 653, 675 [NASA ADS] [CrossRef] [Google Scholar]
- Takeda, Y. 2007, PASJ, 59, 335 [NASA ADS] [Google Scholar]
- Telesco, C. M., Pina, R. K., Hanna, K. T., et al. 1998, in SPIE Conf. Ser. 3354, ed. A. M. Fowler, 534 [Google Scholar]
- Thompson, M. A., Smith, D. J. B., Stevens, J. A., et al. 2010, A&A, 518, L134 [NASA ADS] [CrossRef] [EDP Sciences] [Google Scholar]
- Uzpen, B., Kobulnicky, H. A., Monson, A. J., et al. 2007, ApJ, 658, 1264 [NASA ADS] [CrossRef] [Google Scholar]
- Winters, J. M., Le Bertre, T., Jeong, K. S., Nyman, L., & Epchtein, N. 2003, A&A, 409, 715 [NASA ADS] [CrossRef] [EDP Sciences] [Google Scholar]
- Wright, C. O., Egan, M. P., Kraemer, K. E., & Price, S. D. 2003, AJ, 125, 359 [NASA ADS] [CrossRef] [Google Scholar]
- Wyatt, M. C. 2008, ARA&A, 46, 339 [NASA ADS] [CrossRef] [Google Scholar]
- Wyatt, M. C., Smith, R., Greaves, J. S., et al. 2007a, ApJ, 658, 569 [NASA ADS] [CrossRef] [Google Scholar]
- Wyatt, M. C., Smith, R., Su, K. Y. L., et al. 2007b, ApJ, 663, 365 [NASA ADS] [CrossRef] [Google Scholar]
- Yamamura, I., Makiuti, S., Ikeda, N., et al. 2010, VizieR Online Data Catalog, II/298 [Google Scholar]
- Zuckerman, B., & Webb, R. A. 2000, ApJ, 535, 959 [NASA ADS] [CrossRef] [Google Scholar]
Appendix A: Logs of Subaru/COMICS and Gemini/T-ReCS follow-up observations
Here we show the logs of follow-up MIR observations of some debris disk candidates by Subaru/COMICS (Table A.1) and Gemini/T-ReCS (Table A.2).
Log of Subaru/COMICS observations.
Log of Gemini/T-ReCS observations.
All Tables
Comparison of observed (fobs) and theoretical fractional luminosities (fmax) for our debris disk sample whose age is available.
All Figures
|
Fig. 1 Spatial distributions of A-M dwarf stars from the Tycho-2 Spectral Type Catalogue (Wright et al. 2003). |
| In the text | |
|
Fig. 2 Histogram of the KS − [18] colour of the stars detected at 18 μm for each spectral type star. The results of Gaussian fitting of the histograms are indicated by the dashed lines. The three vertical dotted lines indicate the peak position μKS − [ L18W ] (middle), and 2σ positions (left and right) of the distribution of the KS − [18] colour. |
| In the text | |
|
Fig. 3 NIR–FIR SED of our debris disk candidates with 18 μm excess. The pluses, filled squares, open circles, crosses, open diamonds, open triangles, and filled circles indicate the photometry with the 2MASS, AKARI/IRC, IRAS, MSX, WISE, ground-based observations (Subaru/COMICS and Gemini/T-ReCS), and Spitzer/MIPS, repectively. We also plot contributions of the photosphere (dashed lines) and those of inner disk component (dotted lines) fitted with AKARI/IRC, IRAS, and Spitzer/MIPS measurements by assuming that the debris dust emits blackbody emission. |
| In the text | |
|
Fig. 4 Distributions of Tin (a), Rin (b), fractional luminosity (c), and fobs / fmax (d). Filled and open squares indicate the stars with and without 9 μm excess, respectively. We set Tin at 170 K for the stars without 9 μm excess and photometric information at λ ≳ 24 μm. |
| In the text | |
Current usage metrics show cumulative count of Article Views (full-text article views including HTML views, PDF and ePub downloads, according to the available data) and Abstracts Views on Vision4Press platform.
Data correspond to usage on the plateform after 2015. The current usage metrics is available 48-96 hours after online publication and is updated daily on week days.
Initial download of the metrics may take a while.