Fig. 5
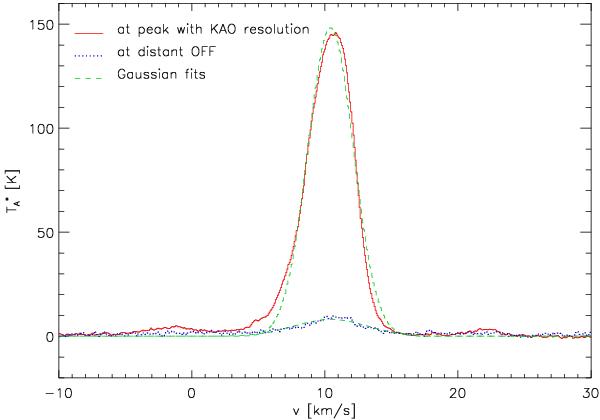
[C ii] profile toward the peak of the Orion Bar emission (5h35m20.6s, −5°25′5′′) averaged over a 43′′ (FWHM) Gaussian beam representing the resolution of the previous KAO observations (solid line). The dotted spectrum represents the widely distributed emission as measured on our secondary OFF position 12.3′ away from the Orion Bar in a region without molecular emission. The dashed lines show Gaussian fits to the two profiles.
Current usage metrics show cumulative count of Article Views (full-text article views including HTML views, PDF and ePub downloads, according to the available data) and Abstracts Views on Vision4Press platform.
Data correspond to usage on the plateform after 2015. The current usage metrics is available 48-96 hours after online publication and is updated daily on week days.
Initial download of the metrics may take a while.