Fig. 4
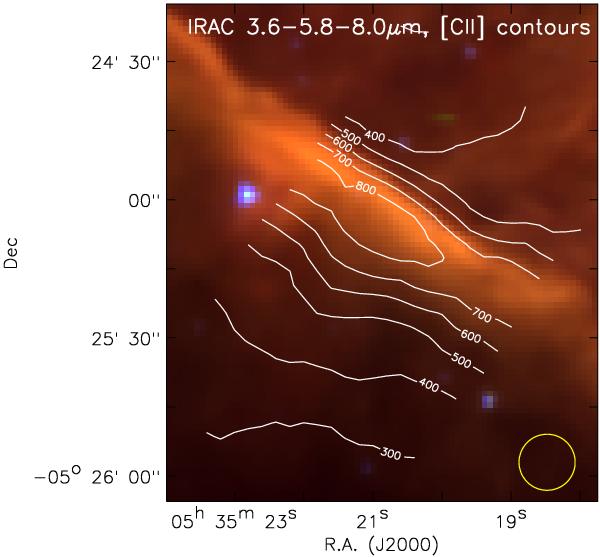
Integrated [C ii] contours over-laid on the false-color IRAC map of the Orion Bar (red: 8.0 μm: 0–3000 MJy/sr, green: 5.8 μm: 0−7000 MJy/sr, blue: 3.6 μm: 0–10 000 MJy/sr). [C ii] is mapped in a strip perpendicular to the Orion Bar. Intensities are labeled in units of K km s-1. The colors in the IRAC map are provided by the signal in the 3.6, 5.8, and 8 μm channels. The yellow circle indicates the HIFI beam size.
Current usage metrics show cumulative count of Article Views (full-text article views including HTML views, PDF and ePub downloads, according to the available data) and Abstracts Views on Vision4Press platform.
Data correspond to usage on the plateform after 2015. The current usage metrics is available 48-96 hours after online publication and is updated daily on week days.
Initial download of the metrics may take a while.