Fig. 3
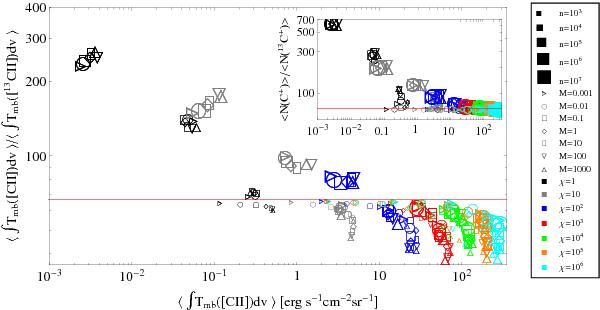
Clump integrated intensity ratio ∫I([C ii])dv/∫I([13C ii])dv vs. [C ii] intensity from the KOSMA-τ model for different parameters. The model parameters n, M, and χ, are coded as size, shape, and color of the respective symbols. The red horizontal line denotes the assumed elemental abundance ratio [12C]/[13C] of 67. The insert demonstrates the underlying column density ratio for the different clumps. For [13C ii], we sum over all hyperfine components.
Current usage metrics show cumulative count of Article Views (full-text article views including HTML views, PDF and ePub downloads, according to the available data) and Abstracts Views on Vision4Press platform.
Data correspond to usage on the plateform after 2015. The current usage metrics is available 48-96 hours after online publication and is updated daily on week days.
Initial download of the metrics may take a while.