Fig. 2
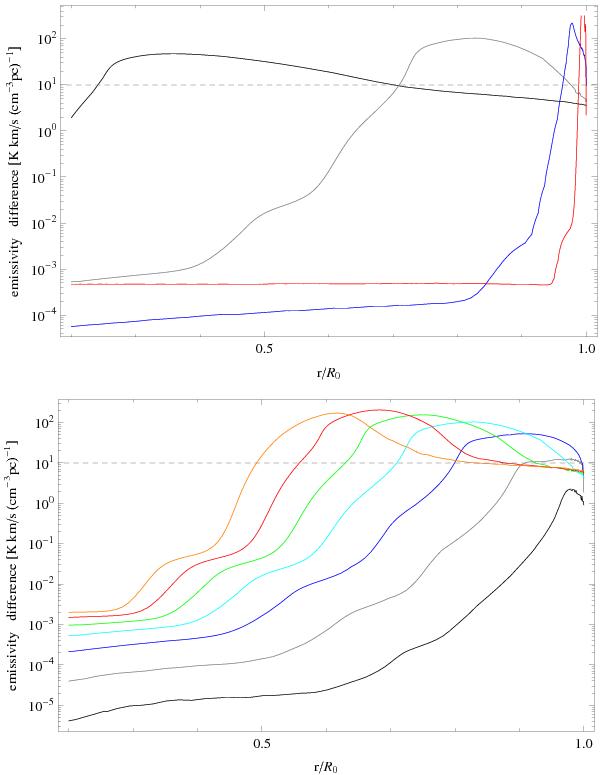
Differences between [C ii] emissivity and [13C ii] emissivity multiplied by the standard elemental isotopic ratio of 67 showing conditions where a increased C+/13C+ fractionation ratio turns into an observable increased [C ii]/[13C ii] intensity ratio. The upper plot uses a radiation field of 1000χ0 and varies the surface gas density: 103 cm-3 (black), 104 cm-3 (grey), 105 cm-3 (blue), 106 cm-3 (red). The lower plot uses a gas density of nsurf = 104 cm-3 and varies the radiation field: 1χ0 (black), 10χ0 (grey), 100χ0 (blue), 103χ0 (cyan), 104χ0 (green), 105χ0 (red), 106χ0 (orange). The dashed line at 10 K km s-1 (cm-3 pc)-1 gives a rough indication what differences might be observable with current technology in a deep integration.
Current usage metrics show cumulative count of Article Views (full-text article views including HTML views, PDF and ePub downloads, according to the available data) and Abstracts Views on Vision4Press platform.
Data correspond to usage on the plateform after 2015. The current usage metrics is available 48-96 hours after online publication and is updated daily on week days.
Initial download of the metrics may take a while.