Free Access
Fig. 11
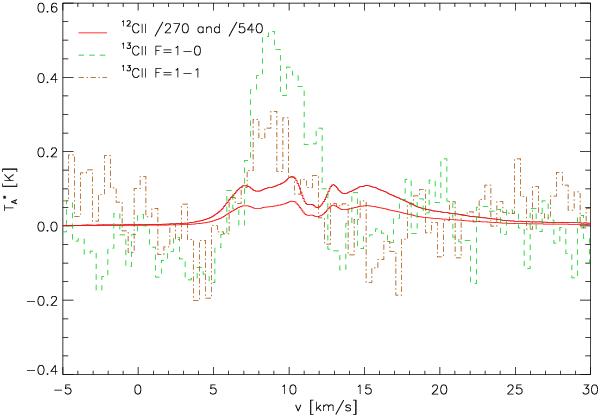
Comparison of the profiles of the [13C ii] hyperfine lines in Mon R2 with the [C ii] profile in the same spectrum scaled by the factors 0.25/67 and 0.125/67. The [13C ii] F = 2−1 component is blended with the main isotopic line so that is not shown here.
Current usage metrics show cumulative count of Article Views (full-text article views including HTML views, PDF and ePub downloads, according to the available data) and Abstracts Views on Vision4Press platform.
Data correspond to usage on the plateform after 2015. The current usage metrics is available 48-96 hours after online publication and is updated daily on week days.
Initial download of the metrics may take a while.