Fig. 1
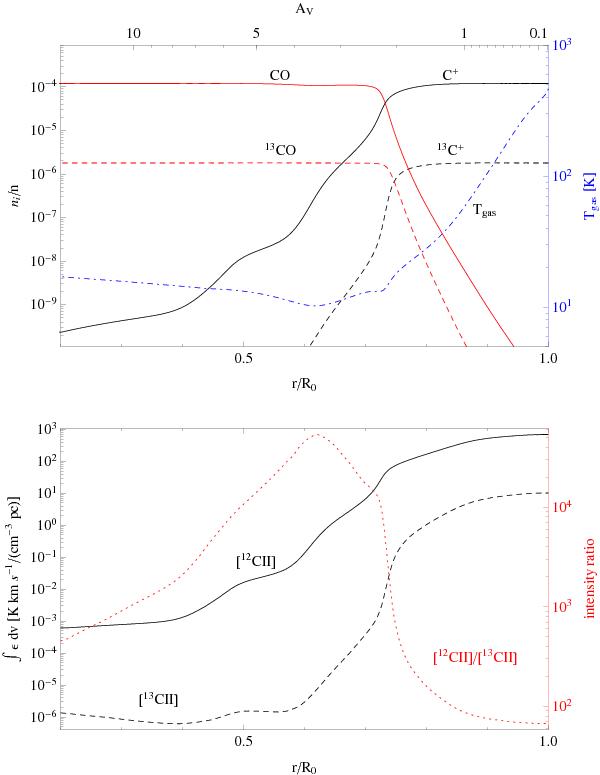
Top: abundance distribution of C+ and CO and the corresponding 13C isotopologues for a model with nsurf = 104 cm-3, 1000 χ0 and 1000 M⊙. The blue curve shows the corresponding gas temperature structure determining the emissivity. Bottom: resulting integrated optically thin line emissivity ∫ϵdv in K km s-1/(cm-3 pc) for the [C ii] and [13C ii] lines (black curves) as a function of the clump radius. The red line shows the intensity ratio provided by the two curves.
Current usage metrics show cumulative count of Article Views (full-text article views including HTML views, PDF and ePub downloads, according to the available data) and Abstracts Views on Vision4Press platform.
Data correspond to usage on the plateform after 2015. The current usage metrics is available 48-96 hours after online publication and is updated daily on week days.
Initial download of the metrics may take a while.