Fig. 6
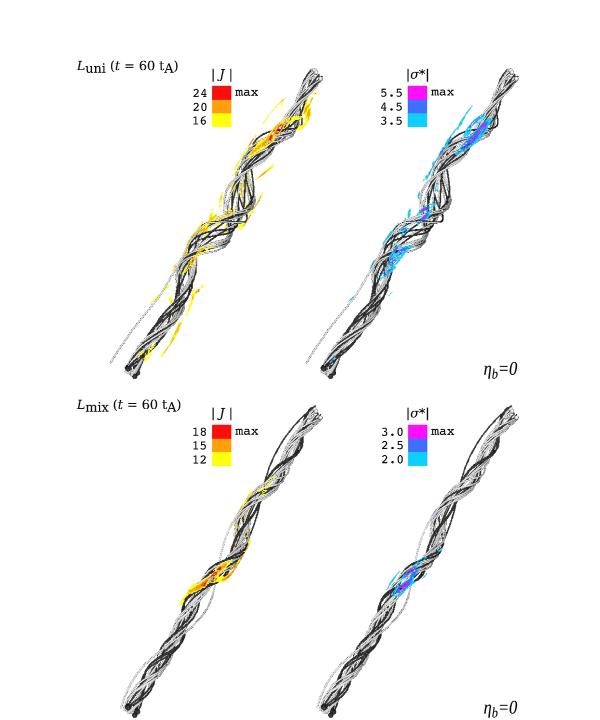
Magnetic field lines originating from the bottom left footpoint (dark grey) and from the upper right footpoint (light grey) are shown at t = 60tA for Luni (top) and Lmix (bottom). At the onset of instability, two plots are shown: one with isosurfaces of current (left) and the other with isosurfaces of | σ∗ |, a proxy for viscous heating (right).
Current usage metrics show cumulative count of Article Views (full-text article views including HTML views, PDF and ePub downloads, according to the available data) and Abstracts Views on Vision4Press platform.
Data correspond to usage on the plateform after 2015. The current usage metrics is available 48-96 hours after online publication and is updated daily on week days.
Initial download of the metrics may take a while.