Fig. 4
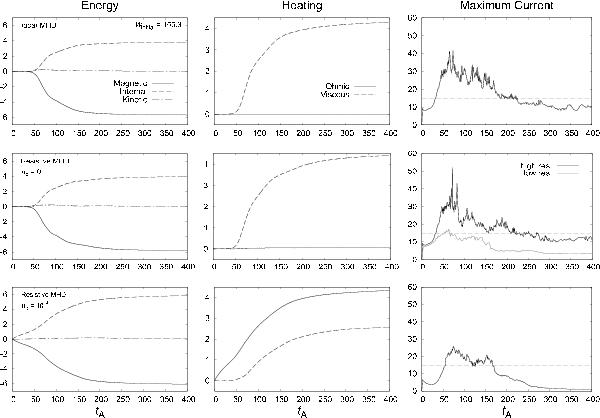
Loop Luni: the temporal variation in energy (magnetic, internal and kinetic), heating (Ohmic and viscous) and maximum current for ideal MHD (top row), for resistive MHD with ηb = 0 (middle row), and for ηb = 10-4 (bottom row). The initial magnetic energy has been subtracted from the magnetic energy plots (solid lines, left column). The critical current (Jcrit = 15) is indicated by the grey dashed horizontal lines (right column). For the ηb = 0 case, the maximum current plots are from the high (black) and low (grey) resolution simulations.
Current usage metrics show cumulative count of Article Views (full-text article views including HTML views, PDF and ePub downloads, according to the available data) and Abstracts Views on Vision4Press platform.
Data correspond to usage on the plateform after 2015. The current usage metrics is available 48-96 hours after online publication and is updated daily on week days.
Initial download of the metrics may take a while.