Fig. 2
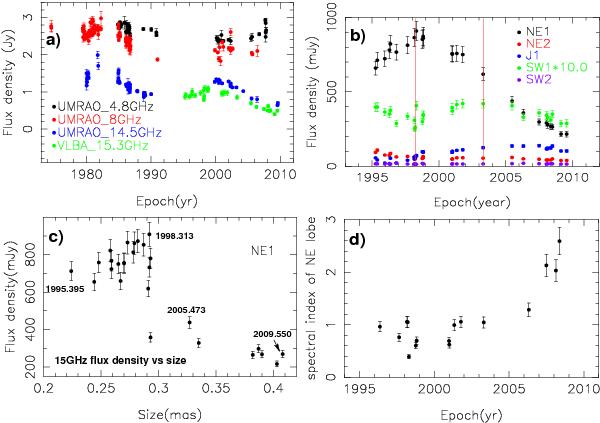
Variability of VLBI components of OQ 208. a) Total flux density
variability of OQ 208 observed with the UMRAO 26-meter radio telescope: 4.8 GHz
(black), 8 GHz (red), 14.5 GHz (blue). The sum of 15-GHz flux densities of the VLBI
components (see Table 1) is represented by green symbols indicating that ~15% is
missed due to lack of short uv-spacings. b) Temporal variations of the
flux densities of VLBI components. The flux densities are derived from the
model-fitting results listed in Table 1. Two vertical lines mark the peak epochs of
NE1 (around 1998.313) and SW1 (around 2003.313). To clearly show the variability
behavior of SW1, the flux densities of SW1 have been multiplied by a factor of 10.
c) Variation of the 15-GHz flux density of the hotspot NE1 with the
component size. The flux density of NE1 experienced a slow rise before epoch
1998.313, followed again by a sharp decline until epoch 2005.473 followed by a slow
decline. The component size constantly increases during the whole period. d)
Temporal variation of the spectral index
 of the NE lobe. The spectral indices are calculated from the 15-GHz MOJAVE data and
8-GHz RRFID data at close epochs. A sharp jump of the spectral index occurs around
2006, after which the spectral index steepens significantly.
of the NE lobe. The spectral indices are calculated from the 15-GHz MOJAVE data and
8-GHz RRFID data at close epochs. A sharp jump of the spectral index occurs around
2006, after which the spectral index steepens significantly.
Current usage metrics show cumulative count of Article Views (full-text article views including HTML views, PDF and ePub downloads, according to the available data) and Abstracts Views on Vision4Press platform.
Data correspond to usage on the plateform after 2015. The current usage metrics is available 48-96 hours after online publication and is updated daily on week days.
Initial download of the metrics may take a while.