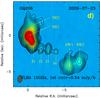
Fig. 1
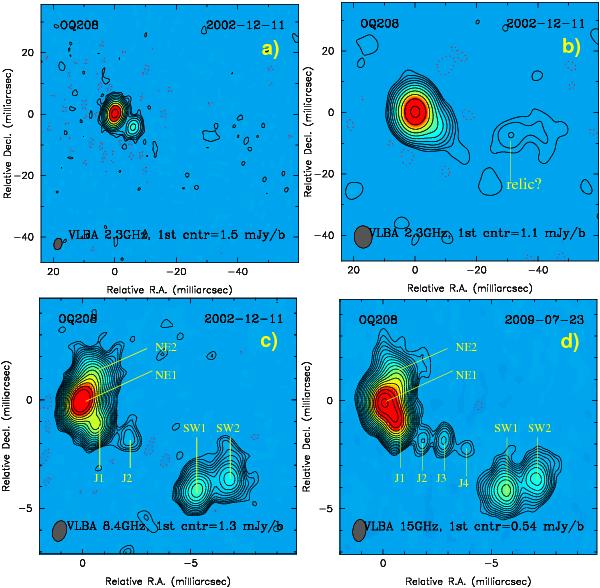
Total intensity image of OQ 208. Panel a) shows the 2.3-GHz VLBI image, displaying a double-component morphology. Panel b) shows the tapered 2.3-GHz image. The extended emission at ~30 mas west of the primary structure is likely a relic radio emission resulting from the past activity a few thousand years ago. Panels c) and d) show the 8.4 and 15 GHz images. Each mini-lobe is resolved into two hotspots. Between the hotspots NE1 and SW1, a knotty jet is detected.
Current usage metrics show cumulative count of Article Views (full-text article views including HTML views, PDF and ePub downloads, according to the available data) and Abstracts Views on Vision4Press platform.
Data correspond to usage on the plateform after 2015. The current usage metrics is available 48-96 hours after online publication and is updated daily on week days.
Initial download of the metrics may take a while.