Fig. 9
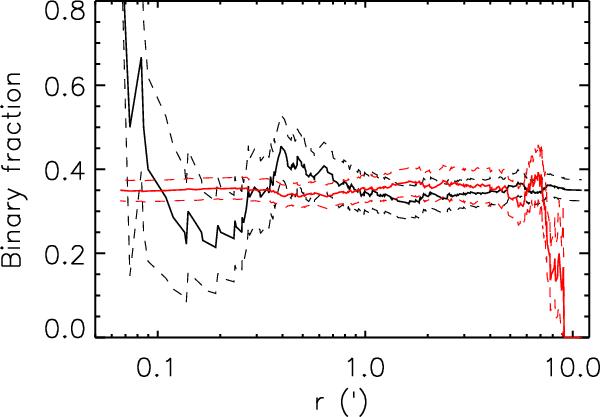
Cumulative radial distribution of the observed binary fraction as a function of the distance to the centre of the field. The black solid line shows the distribution computed inside-out, and the grey/red line shows the distribution computed outside-in. The dashed curves indicate the ± 1σ confidence interval on both curves.
Current usage metrics show cumulative count of Article Views (full-text article views including HTML views, PDF and ePub downloads, according to the available data) and Abstracts Views on Vision4Press platform.
Data correspond to usage on the plateform after 2015. The current usage metrics is available 48-96 hours after online publication and is updated daily on week days.
Initial download of the metrics may take a while.