Fig. 7
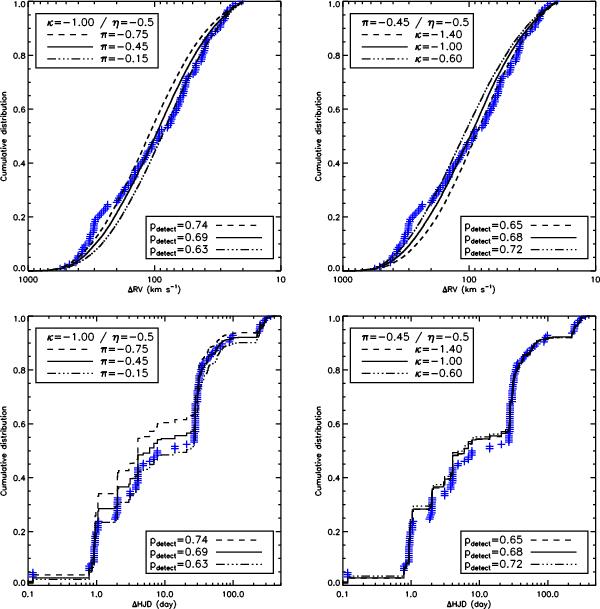
Comparison between the observed (crosses) and simulated (lines) cumulative distributions of the peak-to-peak RV amplitudes (top row) and of the variability time scales (bottom row). In the left- (resp. right-) hand panels, we vary the exponent π of the period distribution (resp. κ of the mass-ratio distribution) by ±1σ. The upper-left legends indicate the values of π, κ and η considered in each panel. The bottom-right legends give the overall VFTS detection probability for the adopted parent distributions.
Current usage metrics show cumulative count of Article Views (full-text article views including HTML views, PDF and ePub downloads, according to the available data) and Abstracts Views on Vision4Press platform.
Data correspond to usage on the plateform after 2015. The current usage metrics is available 48-96 hours after online publication and is updated daily on week days.
Initial download of the metrics may take a while.