Fig.5
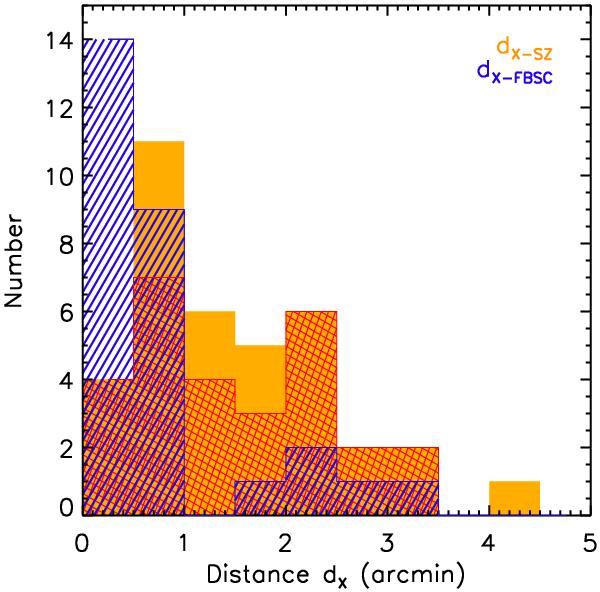
Histogram of the distance between the X-ray peak determined from the XMM-Newton validation observations and the Planck SZ position for all clusters (orange filled) and those associated with a source from the RASS Faint Source Catalogue or Bright Source Catalogue (red hatched). The histogram of the distance between the X-ray peak and the RASS source position is plotted for comparison (blue hatched).
Current usage metrics show cumulative count of Article Views (full-text article views including HTML views, PDF and ePub downloads, according to the available data) and Abstracts Views on Vision4Press platform.
Data correspond to usage on the plateform after 2015. The current usage metrics is available 48-96 hours after online publication and is updated daily on week days.
Initial download of the metrics may take a while.