Fig.3
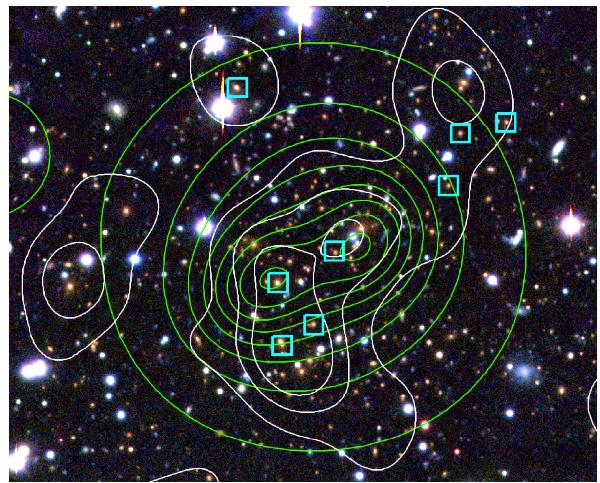
A gri composite image of the central  of PLCKG147.3−16.6, based on imaging data from NOT/MOSCA (g and i) and TNG/DOLORES (r and i). Boxes: cluster galaxies spectroscopically confirmed with Gemini (excluding the two galaxies at z = 0.68). North is up and East to the left. The green contours are isocontours of the wavelet filtered XMM-Newton image. The white contours show the luminosity distribution of the red sequence galaxies indicated by red symbols in Fig. A.2, smoothed with a σ = 14″ Gaussian filter. The plotted contour levels are at (10, 20, 30) times the rms variation in the luminosity distribution.
Current usage metrics show cumulative count of Article Views (full-text article views including HTML views, PDF and ePub downloads, according to the available data) and Abstracts Views on Vision4Press platform.
Data correspond to usage on the plateform after 2015. The current usage metrics is available 48-96 hours after online publication and is updated daily on week days.
Initial download of the metrics may take a while.