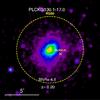
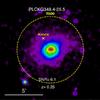
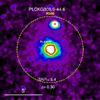
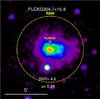
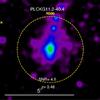
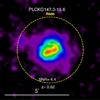
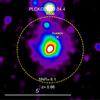
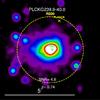
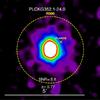
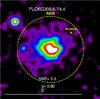
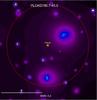
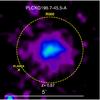
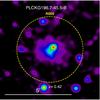
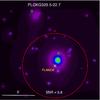
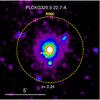
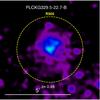
Fig.2
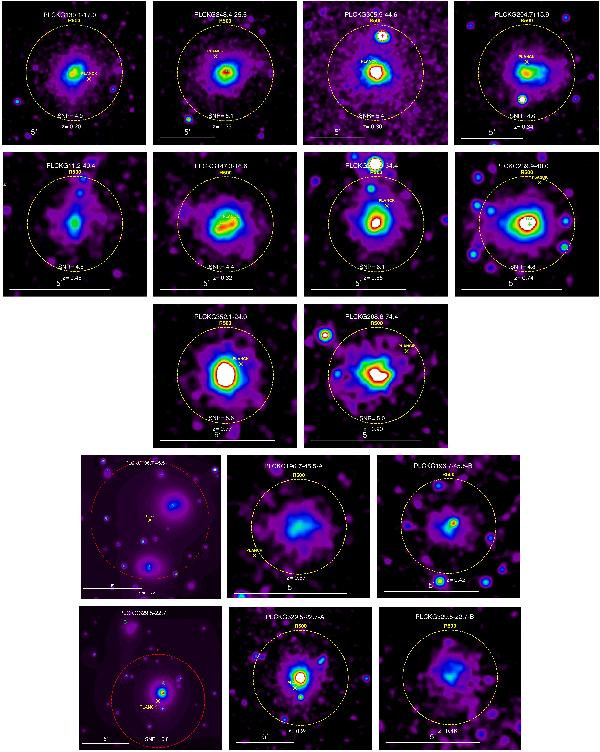
XMM-Newton [0.3−2] keV energy band images of confirmed cluster candidates. North is up and East is to the left. Image sizes are 3θ500 on a side, where θ500 is estimated from the M500 − YX relation of Arnaud et al. (2010) assuming standard evolution. Images are corrected for surface brightness dimming with z, divided by the emissivity in the energy band, taking into account galactic absorption and instrument response, and scaled according to the self-similar model. The colour table is the same for all clusters, so that the images would be identical if clusters obeyed strict self-similarity. A yellow cross indicates the Planck position and a red/green plus sign the position of a RASS-BSC/FSC source. The clusters are sorted according their estimated redshift. For the double systems (last two rows) the middle and right panels show the two components and the left panel the wavelet-filtered overall image.
Current usage metrics show cumulative count of Article Views (full-text article views including HTML views, PDF and ePub downloads, according to the available data) and Abstracts Views on Vision4Press platform.
Data correspond to usage on the plateform after 2015. The current usage metrics is available 48-96 hours after online publication and is updated daily on week days.
Initial download of the metrics may take a while.