Fig.B.2
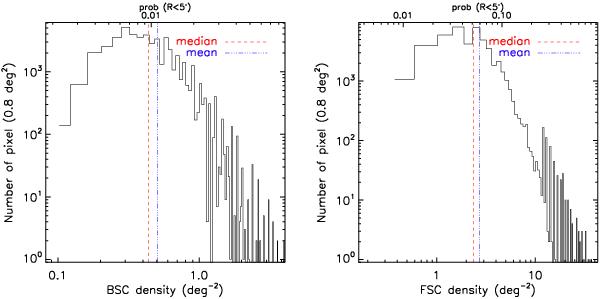
Histogram of the source density map of the RASS-BSC (left panel), and RASS-FSC (right panel), per square degree. The mean and median source density of each map are plotted in blue dot-dot-dot-dash and in red dashed lines, respectively. The upper x-axis shows the associated probability of association within 5′ (see text). The sources are drawn from the whole sky so the solid angle is 4π steradian.
Current usage metrics show cumulative count of Article Views (full-text article views including HTML views, PDF and ePub downloads, according to the available data) and Abstracts Views on Vision4Press platform.
Data correspond to usage on the plateform after 2015. The current usage metrics is available 48-96 hours after online publication and is updated daily on week days.
Initial download of the metrics may take a while.