Fig.B.1
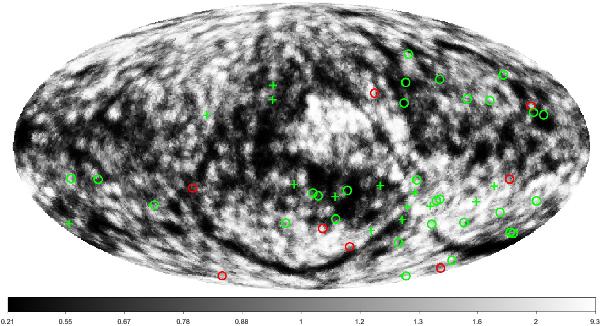
XMM-Newton validation results overplotted on density map of the RASS-Bright Source Catalogue (BSC). The source density map has been normalised by the median of the pixel density distribution. Confirmed candidates are plotted in green and false candidates are plotted in red. Pluses (+ ): good association with a BSC source. Circles (◯ ): no association with a BSC source.
Current usage metrics show cumulative count of Article Views (full-text article views including HTML views, PDF and ePub downloads, according to the available data) and Abstracts Views on Vision4Press platform.
Data correspond to usage on the plateform after 2015. The current usage metrics is available 48-96 hours after online publication and is updated daily on week days.
Initial download of the metrics may take a while.