Fig.A.1
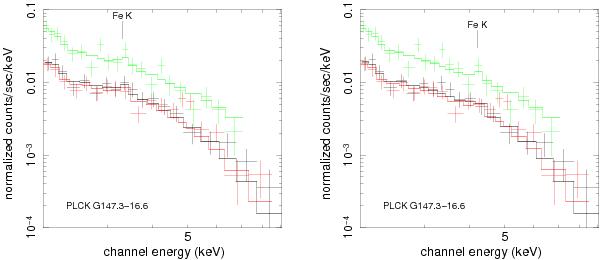
EPIC spectra (data points with errors) of PLCKG147.3−16.6. Only data points above 2 keV are shown for clarity, but data down to 0.3 keV are used in the spectral fitting. The redshift estimate is ambiguous, with the χ2 distribution showing three minima. Left panel: the best-fitting thermal model (solid lines) at z = 1.03 with the position of the redshifted Fe K line marked. Right panel: same for the second best solution at z = 0.62, consistent with the optical redshift.
Current usage metrics show cumulative count of Article Views (full-text article views including HTML views, PDF and ePub downloads, according to the available data) and Abstracts Views on Vision4Press platform.
Data correspond to usage on the plateform after 2015. The current usage metrics is available 48-96 hours after online publication and is updated daily on week days.
Initial download of the metrics may take a while.