Fig.13
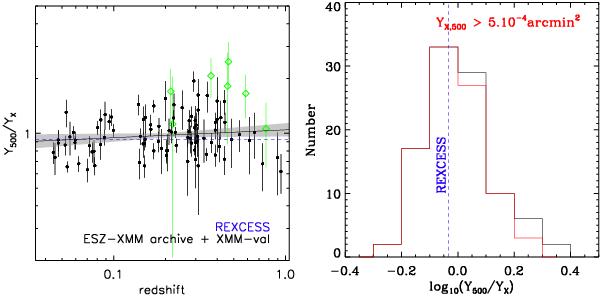
Ratio of the Y500 Compton parameter to the normalised YX parameter. Left panel: variation as a function of redshift. The dotted line is the REXCESS prediction (Arnaud et al. 2010). The full line is the best fit power law and the grey shaded area indicates the ± 1σ uncertainty. Clusters with normalised YX ≲ 5 × 10⁻⁴arcmin2 (green points) were excluded from the fit, to minimise Malmquist bias. Right panel: histogram of the ratio without and with low flux clusters.

Current usage metrics show cumulative count of Article Views (full-text article views including HTML views, PDF and ePub downloads, according to the available data) and Abstracts Views on Vision4Press platform.
Data correspond to usage on the plateform after 2015. The current usage metrics is available 48-96 hours after online publication and is updated daily on week days.
Initial download of the metrics may take a while.