Fig.12
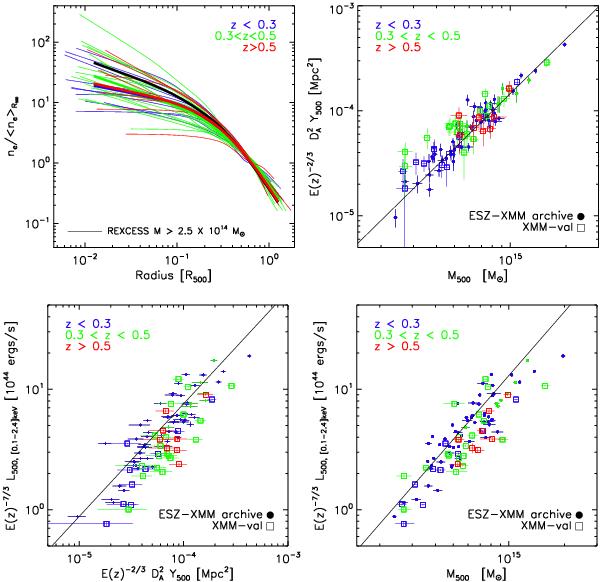
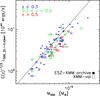
Scaling properties of Planck clusters, colour-coded as a function of redshift. In all figures, R500 and M500 are estimated from the M500–YX relation of Arnaud et al. (2010). Top left panel: the scaled density profiles of the new clusters confirmed with XMM-Newton observations. The radii are scaled to R500. The density is scaled to the mean density within R500. The thick lines denote the mean scaled profile for each sub-sample. The black line is the mean profile of the REXCESS sample (Arnaud et al. 2010). Other panels: scaling relations. Squares show the new clusters confirmed with XMM-Newton observations. Points show clusters in the Planck-ESZ sample with XMM-Newton archival data as presented in Planck Collaboration (2011c). Relations are plotted between the intrinsic Compton parameter,  , and the mass M500 (top right panel), between the X-ray luminosity and Y500 (bottom left panel) and between mass and luminosity (bottom right panel). Each quantity is scaled with redshift, as expected from standard self-similar evolution. The lines in the left and middle panel denotes the predicted Y500 scaling relations from the REXCESS X-ray observations (Arnaud et al. 2010). The line in the right panel is the Malmquist bias corrected M–L relation from the REXCESS sample (Pratt et al. 2009; Arnaud et al. 2010). The new clusters are on average less luminous at a given Y500, or more massive at a given luminosity, than X-ray selected clusters. There is no evidence of non-standard evolution.
Current usage metrics show cumulative count of Article Views (full-text article views including HTML views, PDF and ePub downloads, according to the available data) and Abstracts Views on Vision4Press platform.
Data correspond to usage on the plateform after 2015. The current usage metrics is available 48-96 hours after online publication and is updated daily on week days.
Initial download of the metrics may take a while.